
Recognition Reports
Recognition Reports help organizations measure how appreciation flows across the workplace, ensuring recognition programs are inclusive, effective, and aligned with company values. These reports provide visibility into both recognition received and recognition given, helping HR leaders and managers identify participation trends, high performers, and employees who may be under-recognized.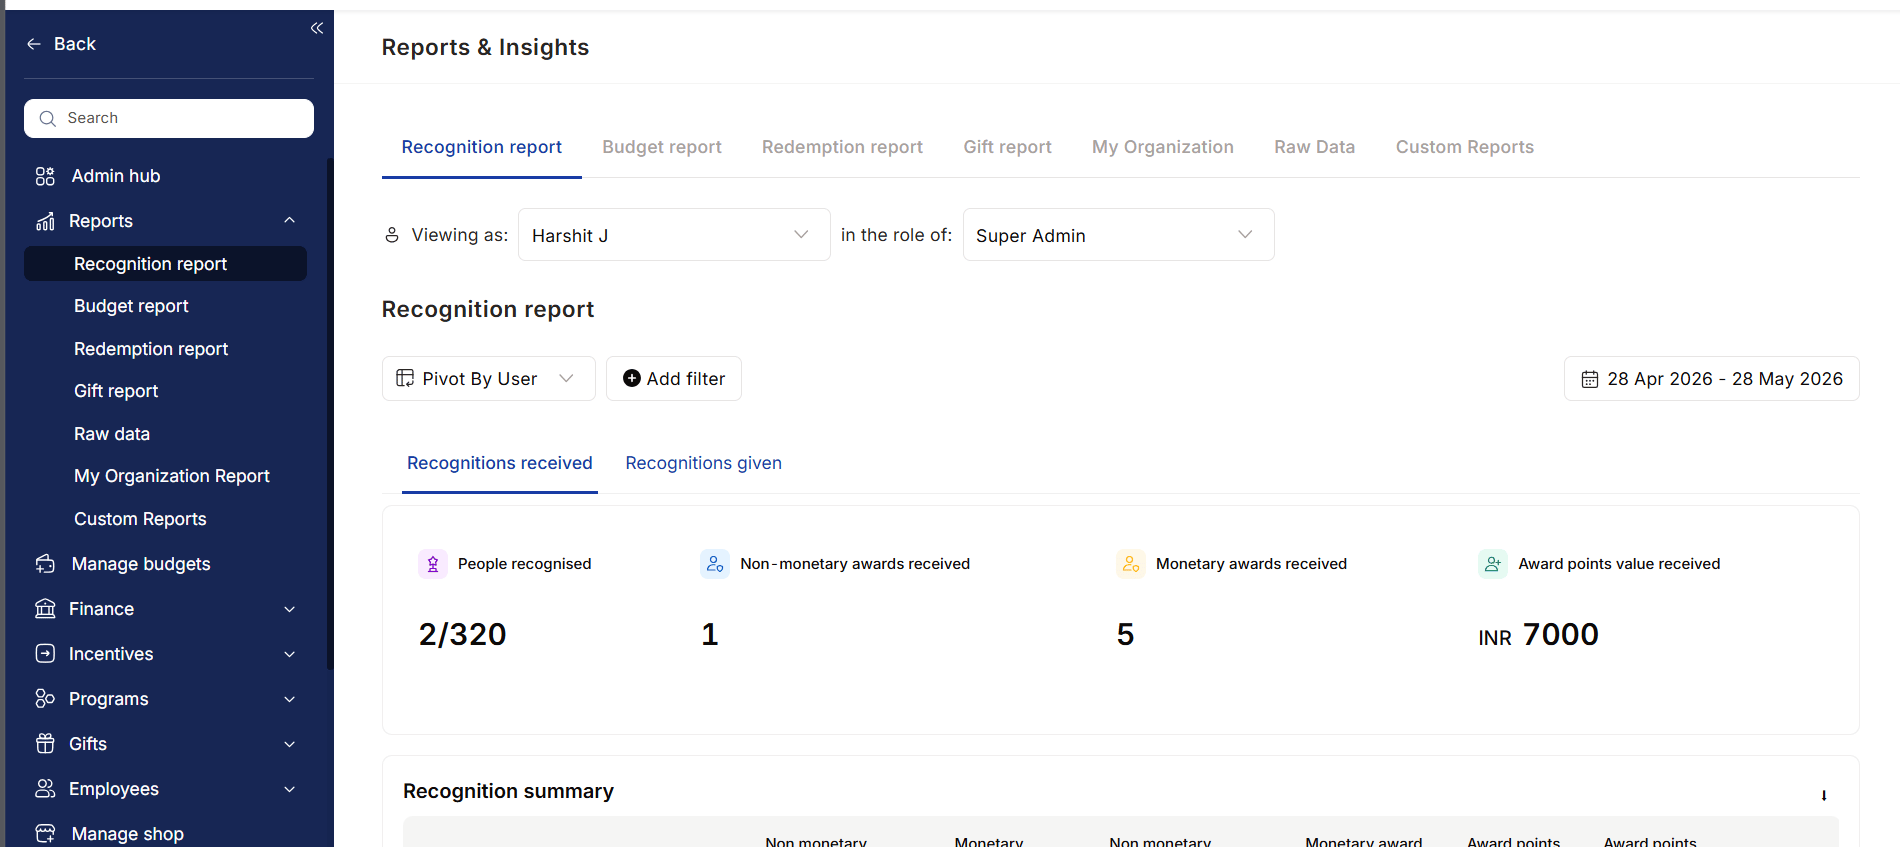
Recognition Received
Track how employees are being recognized across the organization.Key Insights
- Total recognitions received
- Monetary and non-monetary awards earned
- Recognition received from managers vs peers
- Total reward points and redemption value
- Most frequently received awards
- Core values associated with recognition
- Award and nomination history
Recognition Given
Understand how employees, managers, and leaders contribute to the culture of appreciation.Key Insights
- Total employees recognized
- Monetary and non-monetary awards distributed
- Recognition frequency and participation trends
- Most recognized colleagues
- Core values most frequently recognized
- Nominations submitted and approval status
Reporting & Analysis
Recognition Reports provide flexible analysis capabilities through:- Date-based filtering
- Employee-level drilldowns
- Pivot views and segmentation
- Recognition trend analysis
- Manager vs peer recognition insights
Who Uses This Report?
HR & People Teams
Monitor recognition adoption, participation, and alignment with company values.Managers
Track team recognition trends and identify employees who may need greater visibility.Employees
View personal recognition history, awards earned, and recognition received from peers and managers.Business Impact
Recognition Reports help organizations:- Improve employee engagement
- Increase recognition participation
- Identify under-recognized employees
- Reinforce company values
- Measure the effectiveness of recognition programs
- Build a culture of continuous appreciation
Budget Report
The Budget Report provides complete visibility into how reward and recognition budgets are allocated, utilized, and managed across the organization. It helps HR, Finance, and program administrators track spending, monitor budget health, and ensure recognition programs remain financially sustainable.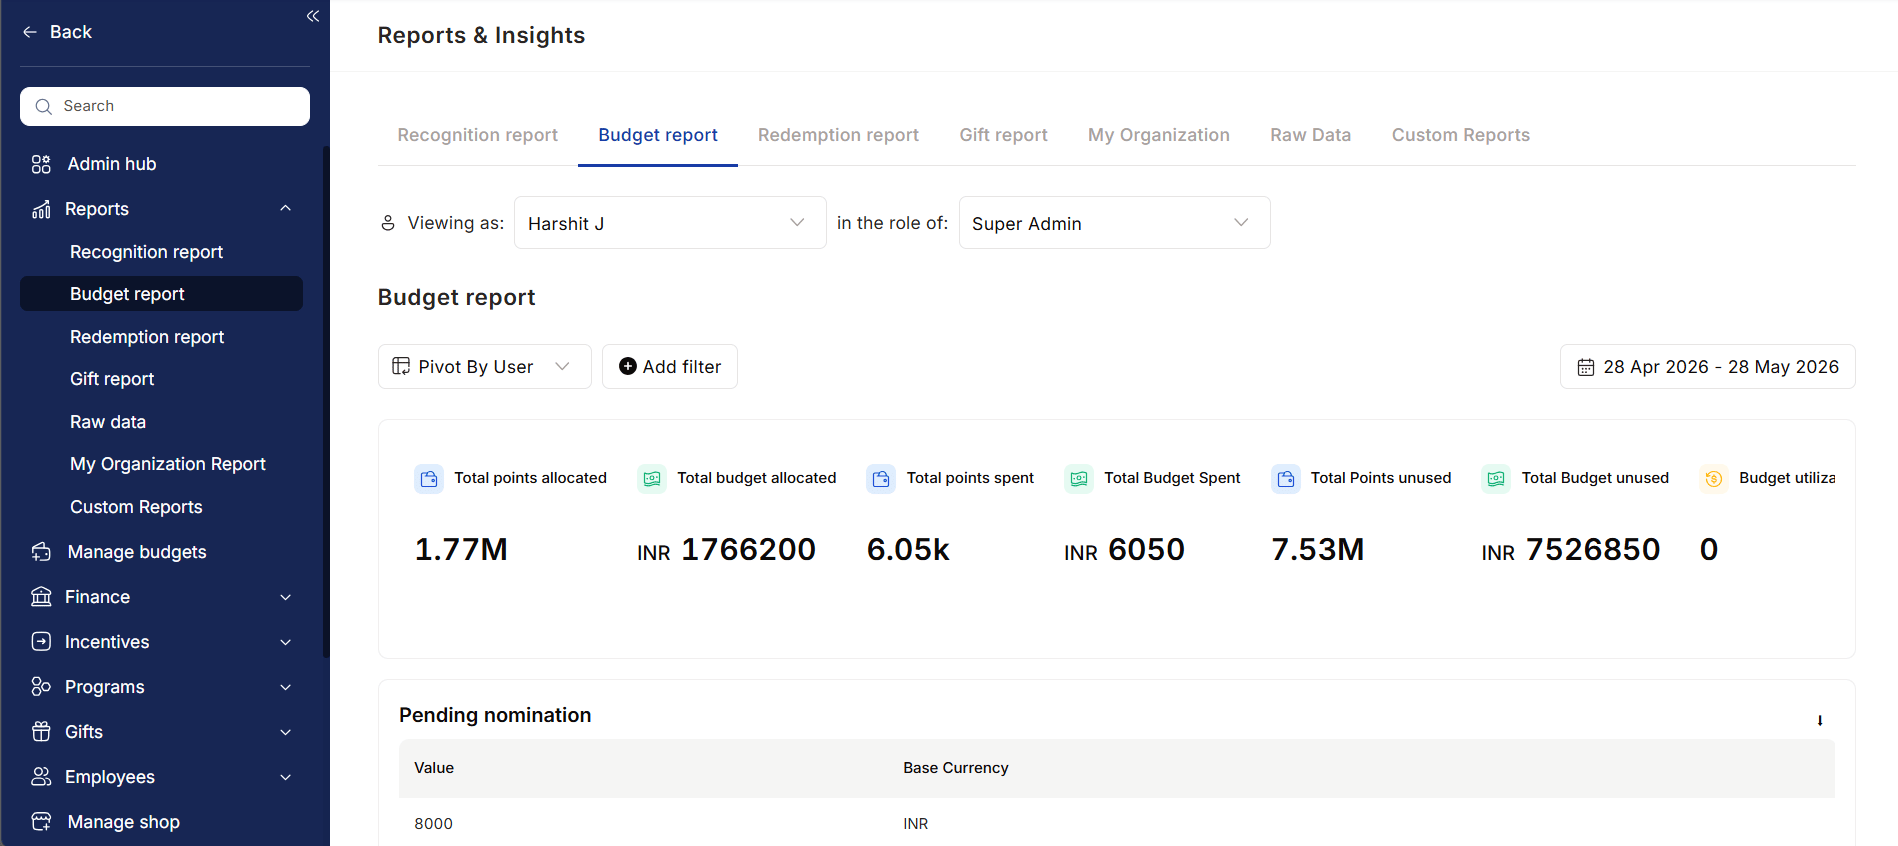
Key Insights
- Total points allocated across all budget owners
- Total budget allocated (monetary value)
- Total points spent
- Total budget spent (monetary value)
- Total points remaining
- Total unused budget value
- Budget utilization percentage
Budget Utilization Analysis
Understand how recognition budgets are being used across teams, departments, and budget owners.Key Insights
- Budget utilization by individual users
- Remaining balance available for spending
- Percentage of budget utilized
- High and low budget adoption trends
- Recognition activity across managers and teams
Pending Spend Visibility
Track upcoming budget commitments through pending nominations and approval-based reward programs.Key Insights
- Value of pending nominations
- Expected future spend
- Budget commitments awaiting approval
- Potential impact on available budgets
Points Movement Tracking
Monitor the complete lifecycle of reward points within the organization.Key Insights
- Points rewarded to employees
- Points distributed through gifting programs
- Points revoked or canceled
- Overall movement of points across the platform
Reporting & Analysis
The Budget Report supports flexible analysis through:- Date-based trend analysis
- User-level reporting
- Department-level reporting
- Budget-specific filtering
- Recipient-based drilldowns
- Utilization comparisons
Who Uses This Report?
HR & People Teams
Track recognition adoption, manager participation, and budget effectiveness.Finance Teams
Monitor spending, unused budgets, and financial planning for reward programs.Program Owners
Manage budget allocations, top-ups, and utilization across recognition initiatives.Leadership
Understand investment in employee recognition and its adoption across the organization.Business Impact
The Budget Report helps organizations:- Improve budget visibility and control
- Optimize reward program spending
- Identify underutilized budgets
- Ensure fair budget distribution
- Support governance and compliance
- Forecast future budget requirements
- Maximize ROI on recognition programs
Redemption Report
The Redemption Report provides visibility into how employees utilize their earned rewards and points. It helps HR, Finance, and program administrators track redemption activity, monitor reward liabilities, manage wallet balances, and ensure financial transparency across reward programs.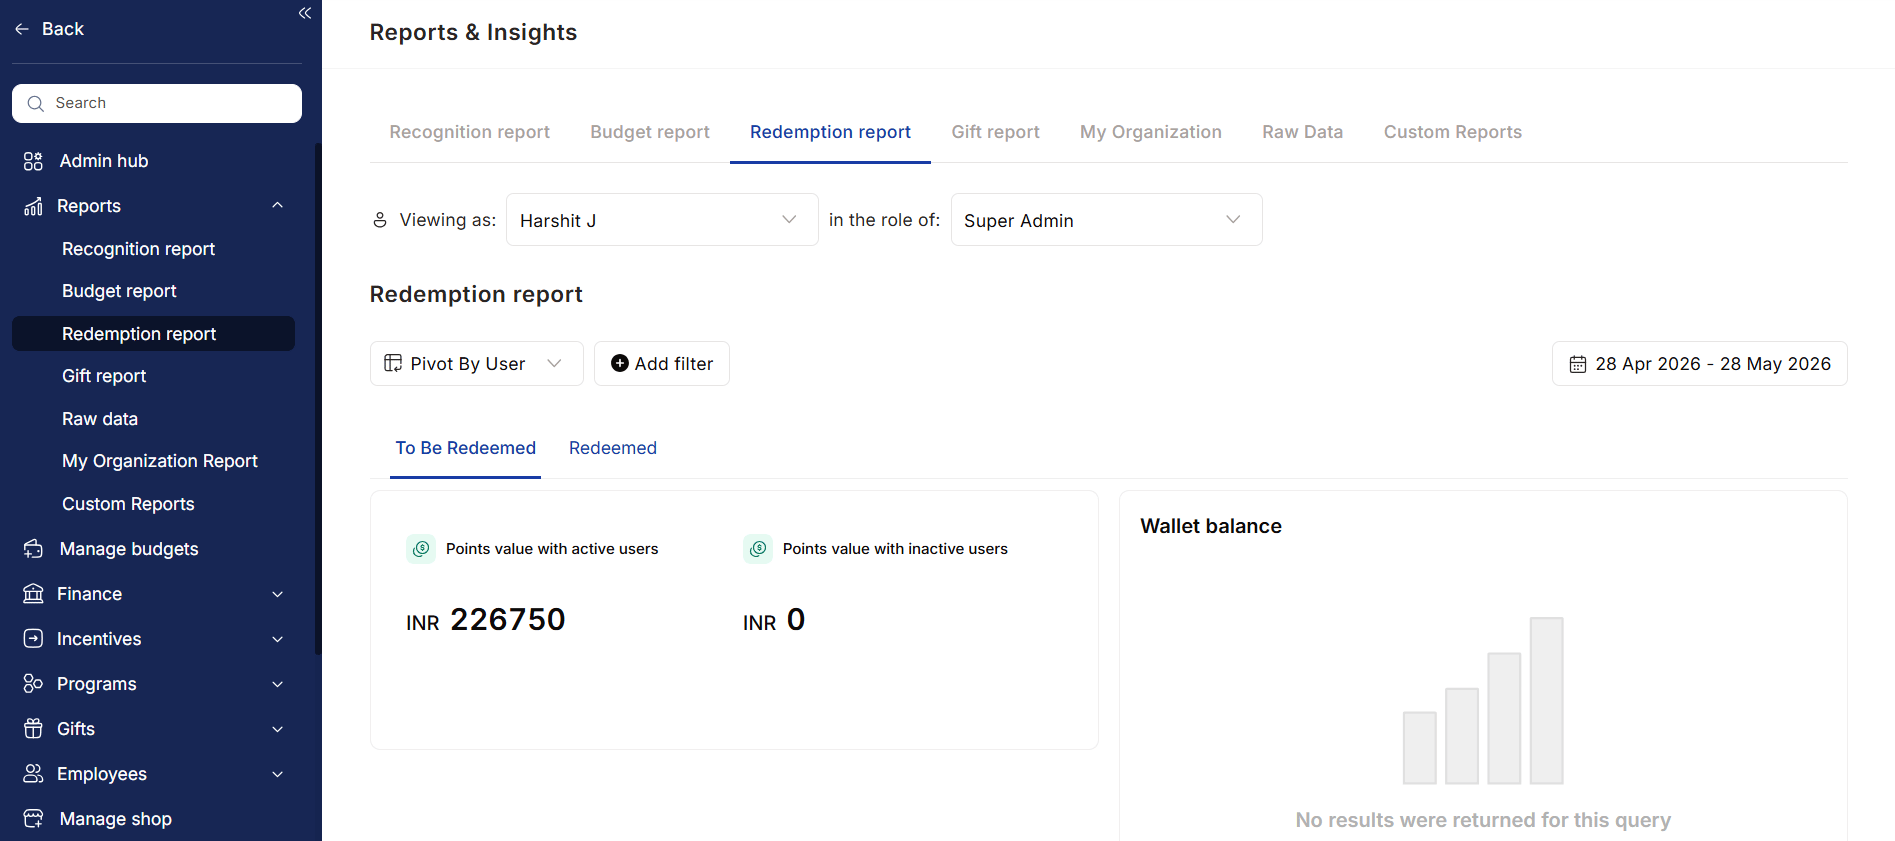
Redemption Overview
Understand both pending and completed redemption activity through two key views:To Be Redeemed
Track reward points that employees have earned but not yet redeemed.Key Insights
- Redeemable points held by active employees
- Redeemable points held by inactive employees
- Current redemption wallet balance
- Outstanding reward liabilities
Redeemed
Monitor points and rewards that have already been redeemed.Key Insights
- Total redeemed points value
- Number of redemption orders placed
- Redemption trends over time
- Employee reward utilization
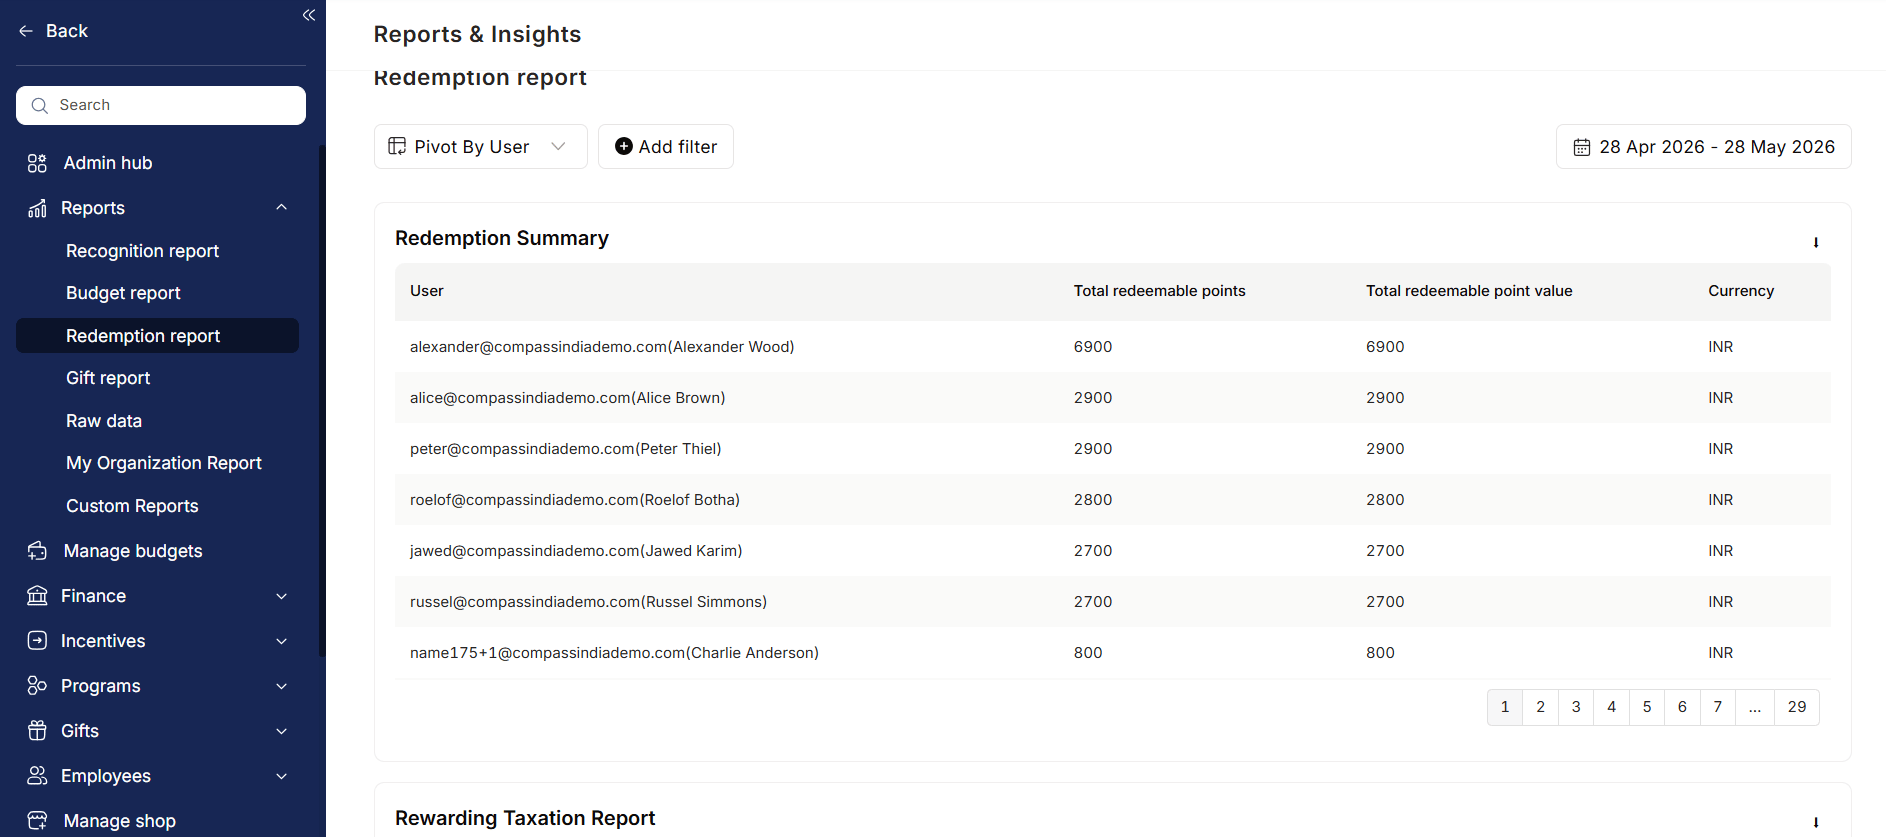
Redemption Summary
Access a detailed view of redemption activity across the organization.Key Insights
- User-wise redemption balances
- Total redeemable points
- Redeemable monetary value
- Currency-wise redemption data
Wallet Management
Monitor the financial health of your rewards program through wallet-level visibility.Key Insights
- Current wallet balances
- Redemption wallet utilization
- Funding requirements
- Available reward budgets
Taxation Reports
Simplify compliance and payroll processing with dedicated reward taxation reports.Rewarding Taxation Report
Track the value of rewards distributed across the organization.Key Insights
- Total points received by employees
- Monetary value of rewards
- Currency of rewards
- Source of rewards and incentives
Redeemed Taxation Report
Track taxation impact based on actual reward redemption activity.Key Insights
- Redeemed reward value
- Taxable redemption benefits
- Employee-wise redemption records
Reporting & Analysis
The Redemption Report supports flexible analysis through:- User-level reporting
- Department-level reporting
- Cost center analysis
- Budget-based filtering
- Recipient-based filtering
- Redemption trend analysis
Who Uses This Report?
HR & People Teams
Monitor employee reward adoption, identify low-redemption groups, and improve engagement with reward programs.Finance Teams
Track redemption liabilities, reconcile wallet balances, and support payroll taxation processes.Program Administrators
Manage wallet funding, monitor redemption trends, and evaluate reward catalog performance.Business Impact
The Redemption Report helps organizations:- Track reward utilization and engagement
- Monitor outstanding redemption liabilities
- Improve financial planning and forecasting
- Simplify reward taxation and compliance
- Manage wallet funding efficiently
- Optimize reward catalog effectiveness
Gift Report
The Gift Report provides complete visibility into all gifts distributed across the organization, helping HR teams, administrators, and finance stakeholders track gifting activity, monitor spend, and ensure employees receive timely celebrations and milestone rewards. The report captures both automated and manually distributed gifts, providing a centralized view of gifting programs and their impact on employee experience.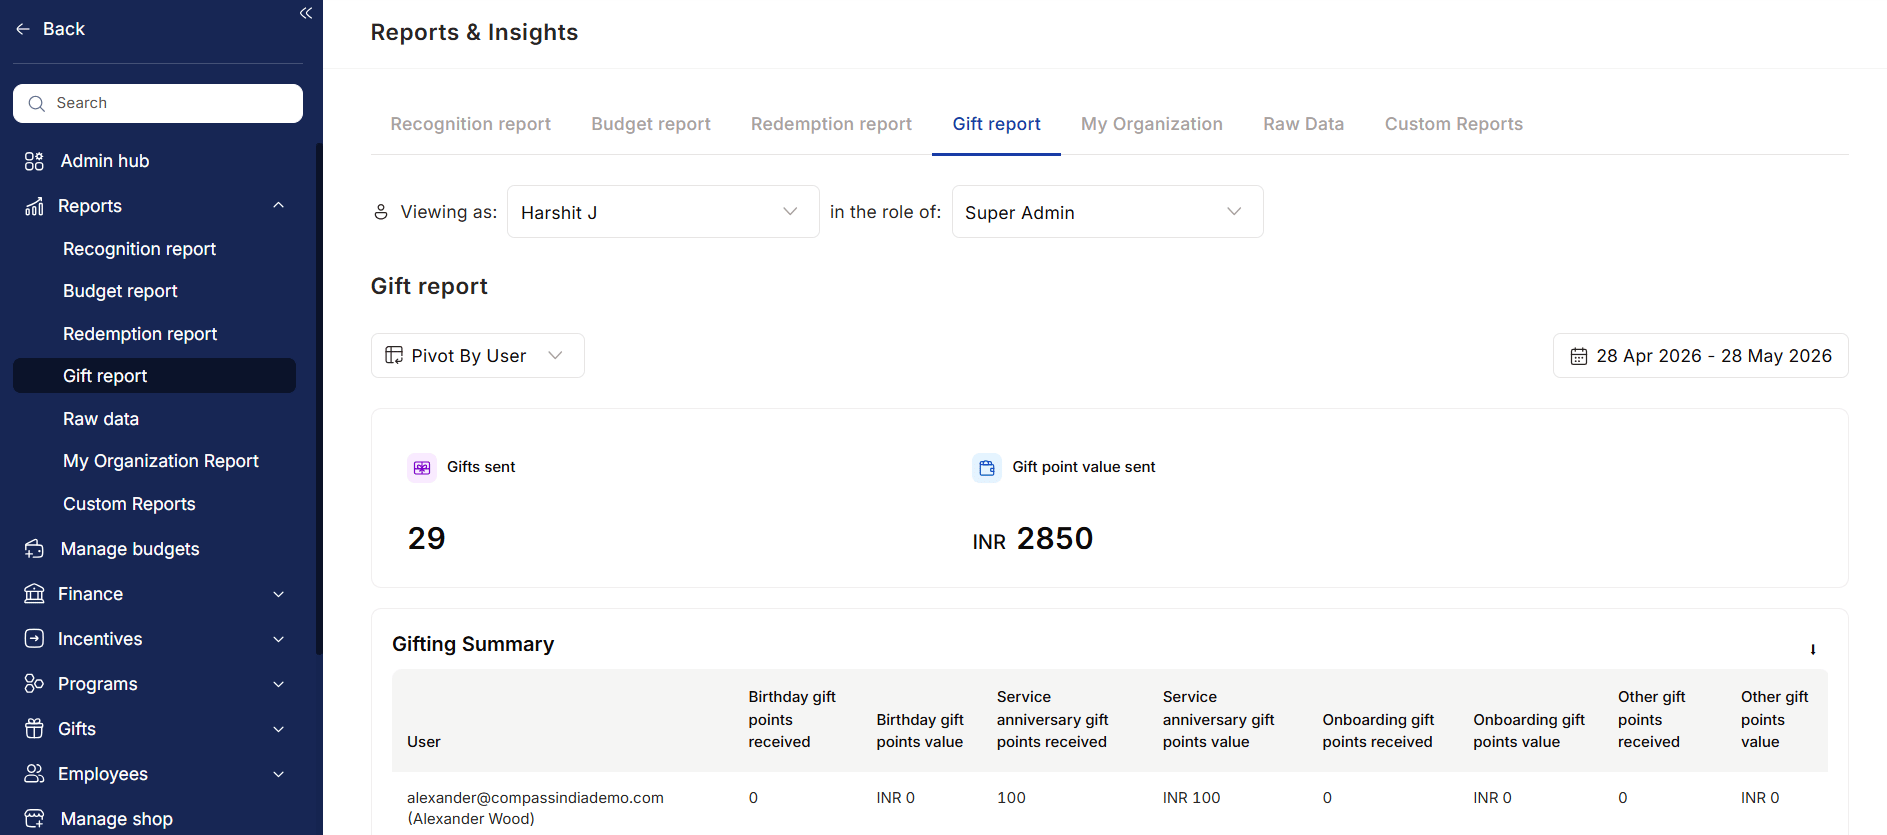
Gift Overview
Get a high-level summary of gifting activity across the organization.Key Insights
- Total gifts sent
- Total gift points distributed
- Monetary value of gifts sent
- Overall gifting activity during the selected period
Gifting Summary
Track gift distribution at an employee level to understand how gifting programs are being utilized.Key Insights
- Birthday gifts received
- Service anniversary gifts received
- Onboarding gifts received
- Other occasion-based gifts received
- Gift points distributed
- Monetary value of gifts received
Automated Gifts Report
Monitor gifts that are triggered automatically through predefined workflows and employee lifecycle events.Common Automated Gifts
- Birthday gifts
- Work anniversary gifts
- Long service awards
- New joiner welcome gifts
- Learning milestone rewards
- Custom automated gifting programs
Key Insights
- Gift category
- Number of automated triggers
- Distribution trends across milestones
- Reach of gifting programs
Manual Gifts Report
Track gifts distributed manually by HR teams, managers, or program owners.Common Manual Gifts
- Festival gifts
- Contest rewards
- Spot appreciation gifts
- Team celebration rewards
- Event-based gifting
Key Insights
- Number of manual gifts distributed
- Gift categories used
- Recipient details
- Associated gift value
Reporting & Analysis
The Gift Report supports flexible reporting through:- User-level reporting
- Department-level analysis
- Cost center reporting
- Gift category analysis
- Date-based trend analysis
- Organizational filtering
Who Uses This Report?
HR & People Teams
Ensure employees receive milestone and celebration gifts while tracking program adoption.Managers
Review gifting activity across teams and ensure recognition is distributed fairly.Finance Teams
Monitor gifting spend, validate budget utilization, and support compliance requirements.Program Administrators
Track automated workflows, monitor manual gifting activity, and manage engagement programs.Business Impact
The Gift Report helps organizations:- Ensure employees receive milestone celebrations
- Improve visibility into gifting programs
- Monitor gifting budgets and spend
- Audit automated and manual gifting activity
- Strengthen employee experience initiatives
- Measure engagement through celebration programs
Raw Data Report
The Raw Data Report provides Super Admins with direct access to detailed platform-level data across recognition, rewards, gifting, budgets, surveys, user activity, and system transactions. It serves as a centralized reporting layer for auditing, compliance, analysis, and operational reporting. Unlike summary reports that focus on aggregated insights, the Raw Data Report allows administrators to access granular records and export data for deeper investigation and custom analysis.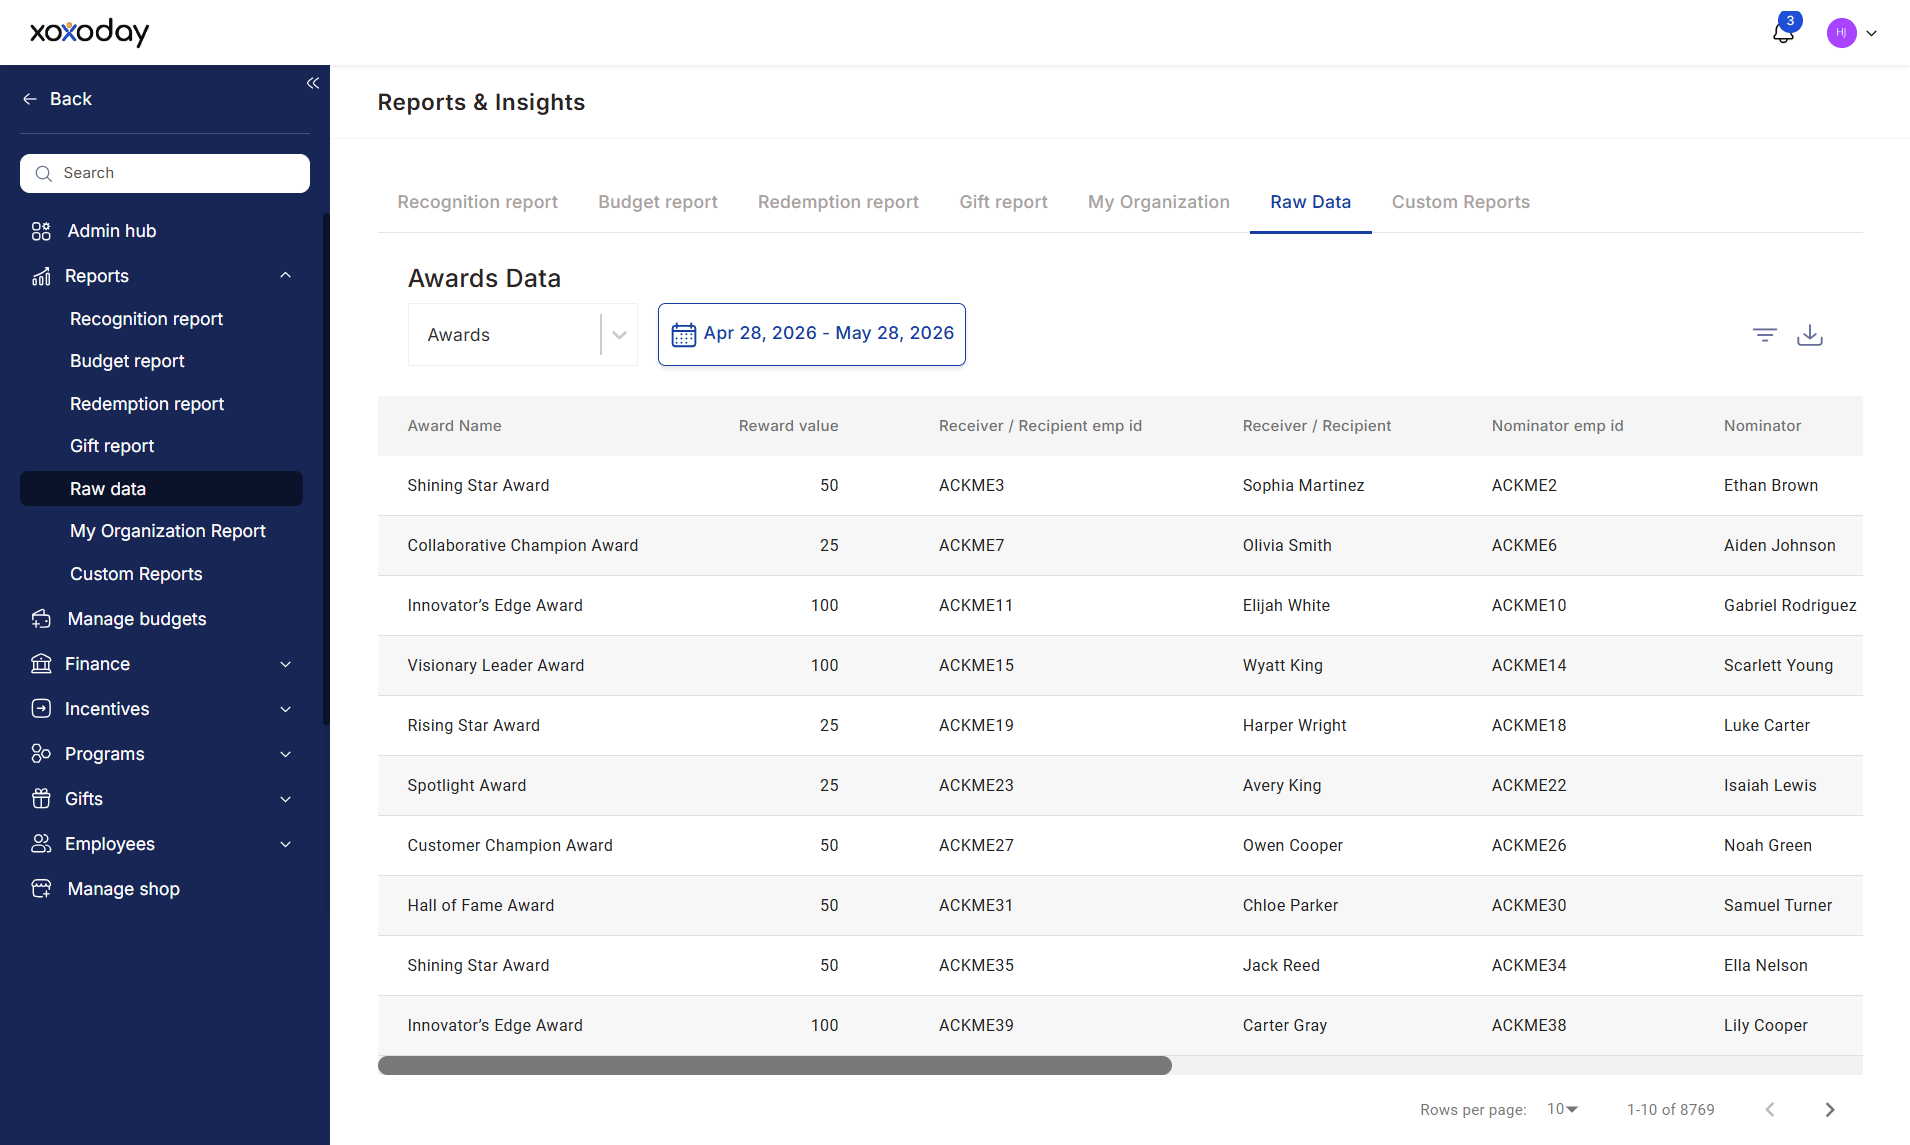
Comprehensive Data Access
The report provides access to raw records across multiple areas of the platform, including:Recognition & Rewards
- Awards
- Core Values
- Leaderboards
- Reward Points Expiry
- Destroyed Reward Points
Budget & Financial Data
- Budgets
- Budget Transactions
- Reward-Based Taxation
- Redemption-Based Taxation
Gifting & Redemption
- Gifts
- Redeemable Links
- Redemption Records
Employee Engagement
- Surveys
- Conversations
User Activity & Audit Logs
- Login Activity
- Proxy Login Activity
- User Audit Logs
Advanced Filtering & Analysis
The Raw Data Report supports flexible filtering to help administrators quickly locate relevant information.Key Capabilities
- Date-range filtering
- Category-specific reporting
- User-level analysis
- Transaction-level visibility
- Audit trail tracking
- Export-ready datasets
Audit & Compliance Visibility
The report provides detailed activity logs that help organizations maintain transparency and governance.Key Use Cases
- Track user activity and system access
- Review budget and reward transactions
- Validate gifting and redemption records
- Monitor changes made within the platform
- Support internal audits and compliance reviews
Who Uses This Report?
Super Admins
Access detailed platform data for operational oversight, troubleshooting, and governance.HR & People Teams
Review recognition, rewards, gifting, and survey-related data for analysis and reporting.Finance Teams
Validate budget transactions, reward distributions, taxation reports, and redemption activity.Compliance & Audit Teams
Maintain audit trails, investigate discrepancies, and support regulatory or internal compliance requirements.Business Impact
The Raw Data Report helps organizations:- Access detailed platform records in one place
- Improve reporting accuracy and transparency
- Support audits and compliance requirements
- Investigate user activity and transactions
- Validate reward, gifting, and budget data
- Generate custom reports for business analysis
Custom Reports
Custom Reports allow administrators to create tailored reports by combining specific data sources, filters, and date ranges. These reports help teams focus on the metrics that matter most, making it easier to monitor programs, track performance, and share insights with relevant stakeholders. Custom Reports can be saved, shared, edited, and reused, eliminating the need to repeatedly configure the same report.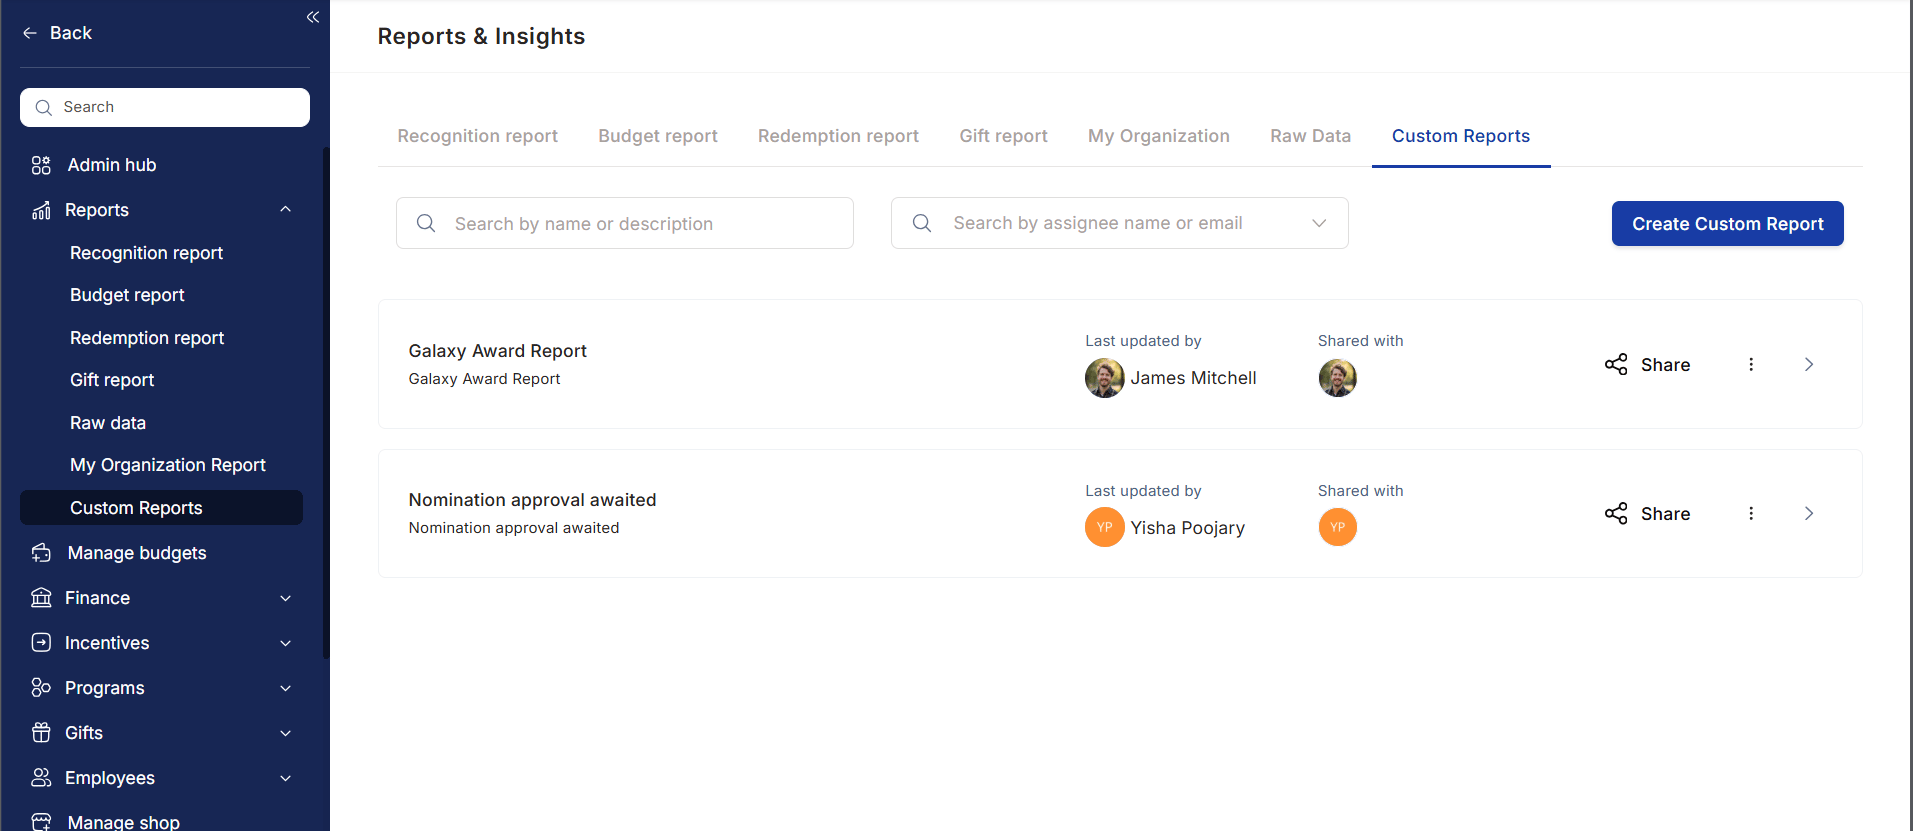
Create Tailored Reports
Build reports using data from multiple reporting categories across the platform.Available Report Sources
- Awards
- Gifts
- Nominations
- Budget
- Redemption
- Reward-Based Taxation
- Redemption-Based Taxation
Flexible Filtering & Analysis
Customize reports using a variety of filters and reporting options.Key Capabilities
- Date-range filtering
- User-level reporting
- Department-level reporting
- Cost center analysis
- Budget-specific filtering
- Recipient-based filtering
- Custom report configurations
Report Management
Easily manage and organize custom reports from a centralized location.Key Capabilities
- Search reports by name or description
- Locate reports using associated email addresses
- Edit existing reports
- Delete outdated reports
- Share reports with stakeholders
Role-Based Viewing
Empuls allows stakeholders to view reports based on their role and access permissions, ensuring relevant insights while maintaining data privacy.View As Employee
Administrators can switch report views to see exactly what another employee, manager, or stakeholder can access.Benefits
- Validate report visibility
- Troubleshoot access issues
- Verify reporting permissions
- Improve governance and compliance
Access by Role
Super Admins
Access organization-wide reports, budgets, recognition activity, and program performance data.Managers
View team-level recognition, participation, and engagement insights for their reporting hierarchy.HR Business Partners (HRBPs)
Access reports for assigned business units or departments to monitor adoption and program effectiveness.Cost Center Heads
Review recognition budgets, award utilization, and participation trends within their cost centers. This role-based approach ensures stakeholders receive relevant insights without exposing unnecessary organizational data.Reporting & Sharing
Custom Reports can be configured once and reused whenever needed.Key Benefits
- Save frequently used reports
- Share reports with stakeholders
- Standardize reporting across teams
- Reduce manual reporting effort
- Enable consistent decision-making
Business Impact
Custom Reports help organizations:- Create highly targeted reports for specific business needs
- Reduce manual reporting effort
- Improve reporting accuracy and consistency
- Enable role-based access and governance
- Support compliance and operational reviews
- Share actionable insights across stakeholders
FAQs
What types of reports and analytics can I view on the platform?
What types of reports and analytics can I view on the platform?
The platform provides a comprehensive suite of tools to track engagement and budget. Key reporting features include:
- AI Co-pilot: Get real-time answers and insights regarding user activity, nominations, and budget utilisation.
- Predictive analytics: Access forward-looking data to help you spot trends and make proactive decisions.
- Custom reports: Create tailored views and dashboards that align with your specific organisational KPIs.
- Integrated insights: View recommendations and data directly within your daily tools (Microsoft Teams, Outlook) via APIs.
What are the reporting capabilities of the Empuls solution?
What are the reporting capabilities of the Empuls solution?
The platform provides a robust reporting architecture to deliver actionable insights for HR leaders, managers, programme admins, and employees. Reports include:
- Recognition activity reports: Track recognition trends, top recipients, and engagement levels.
- Rewards reports: Gain visibility into redemption patterns, reward popularity, and point utilisation.
- Programme adoption reports: Understand participation across departments and individuals.
Does the platform provide role-based dashboards for HR, admins, and managers?
Does the platform provide role-based dashboards for HR, admins, and managers?
Yes. The platform provides role-based dashboards for HR, administrators, and managers. Through these dashboards, admins can access:
- Recognition analytics: Trends in peer-to-peer and manager-to-employee recognition, top award givers and receivers, and budget utilisation.
- Engagement metrics: Active users, pending nominations, survey participation, and social intranet activity.
- Programme effectiveness: Adoption rates, attrition impact analysis, and the contribution of recognition to retention.
- Financial oversight: Allocation and utilisation of reward budgets, redemption patterns, and vendor performance.
- Custom reports: Drill-down options by employee, department, geography, or time period, with export functionality for further analysis.
- AI-powered insights: Predictive analytics, nudges for under-recognised employees, and recommendations to optimise recognition programmes.
How does the platform provide analytics for end users?
How does the platform provide analytics for end users?
The platform offers a structured analytics framework with pre-configured dashboards for all stakeholder levels:
- My reports (employees): Personal participation, recognition history, survey responses, and rewards earned.
- My team reports (managers): Team engagement, recognition frequency, survey response rates, and performance indicators.
- My organisation (HR and leadership): Macro-level analytics including engagement trends, survey scores, adoption metrics, and recognition equity.
Can reports be filtered by department, function, or business unit?
Can reports be filtered by department, function, or business unit?
Yes. The platform provides flexible reporting capabilities that allow filtering by department, function, business unit, region, and more. Filters are available across recognition trends, reward redemptions, survey responses, and engagement metrics. Filtered views help users identify gaps in recognition equity, low-engagement teams, and adoption rates. Reports can be exported in CSV or PDF for deeper analysis or sharing with leadership.
How many standard reports are available?
How many standard reports are available?
The platform offers a comprehensive analytics suite with real-time dashboards and detailed raw data reports.Dashboards include:
- My Reports — Individual user insights
- My Team Reports — Manager view for team-level engagement and usage
- My Organisation Reports — Admin view for company-wide participation, trends, and point utilisation
Related
Admin hub
Navigate the admin dashboard and all admin tools.
Awards and core values
Set up the awards that feed recognition report data.
Budgets
Configure the budgets that appear in budget reports.
Access control
Control who sees which reports and dashboards.