> ## Documentation Index
> Fetch the complete documentation index at: https://help-empuls.xoxoday.com/llms.txt
> Use this file to discover all available pages before exploring further.
# Metrics
> Learn more about metrics
## Metrics Overview
A quantitative measurement of your data. Metrics in Analytics can be sums, ratios, etc. Metrics are individual elements of a dimension that can be measured as a sum or a ratio.
For example, the dimension Total Population can be associated with a metric like *Population*, which would have a sum value of all the residents of the specific city.
Metrics comprise the logic of your incentive campaigns. It’s a GUI-based rule builder palette with standard and advanced mathematical and logical functions that enable you to break down, design and customize your most complex structures and campaigns.
**1. Linear Metric -** A metric that takes a single input value, transforms it based on a linear function and stores it.
**2. Aggregate Metric -** The process of taking multiple input values and then using them to produce a single output via the rules defined by the aggregation type. For example, taking an average of multiple values.
The sales incentive platform has AVERAGE, SUM, and COUNT functions as aggregate functions.
**3. Mapping Variable Metric** - It is used to assign values based on predefined mappings between input variables and corresponding output values. It acts like a lookup table or conditional logic block, mapping specific inputs to specific outputs.
This metric type is useful when different values need to be assigned based on rules such as tier levels, region names, performance bands, or any categorized input.
## Why do we need METRICs?
Every report in Analytics is made up of dimensions and metrics. Metric is the building block for any Plan that is configured on the platform.
Let us consider a simple example to understand the relevance of metrics and how and where they need to be used:
| | |
| ----------------------- | -------------- |
| **Incentive Structure** | |
| Slab | Flat Incentive |
| Ach % \< 50% | \$1,000 |
| Ach % \< 75% | \$2,000 |
| Ach % \< 100% | \$3,000 |
| Ach % >= 100% | \$5,000 |
Dimensions (Name of Metric) are attributes of your data. For example, the dimension *City* indicates the city, such as "Paris" or "New York," from which a session originates.
Metrics are quantitative measurements. The metric *Sessions* is the total number of sessions, and the metric *Pages/Session* is the average number of pages viewed per session.
The tables in most Analytics reports organize dimension values into rows and metrics into columns.
For example, this table shows one dimension (*City*) and two metrics (*Sessions* and *Pages/Sessions*).
| | | |
| ------------- | ------------ | ----------------- |
| **DIMENSION** | **METRIC** | **METRIC** |
| **City** | **Sessions** | **Pages/Session** |
| San Francisco | 5,000 | 3.74 |
| Berlin | 4,000 | 4.55 |
## Creating METRICs
Metrics are parameters based on which participants are evaluated and are rewarded incentives.
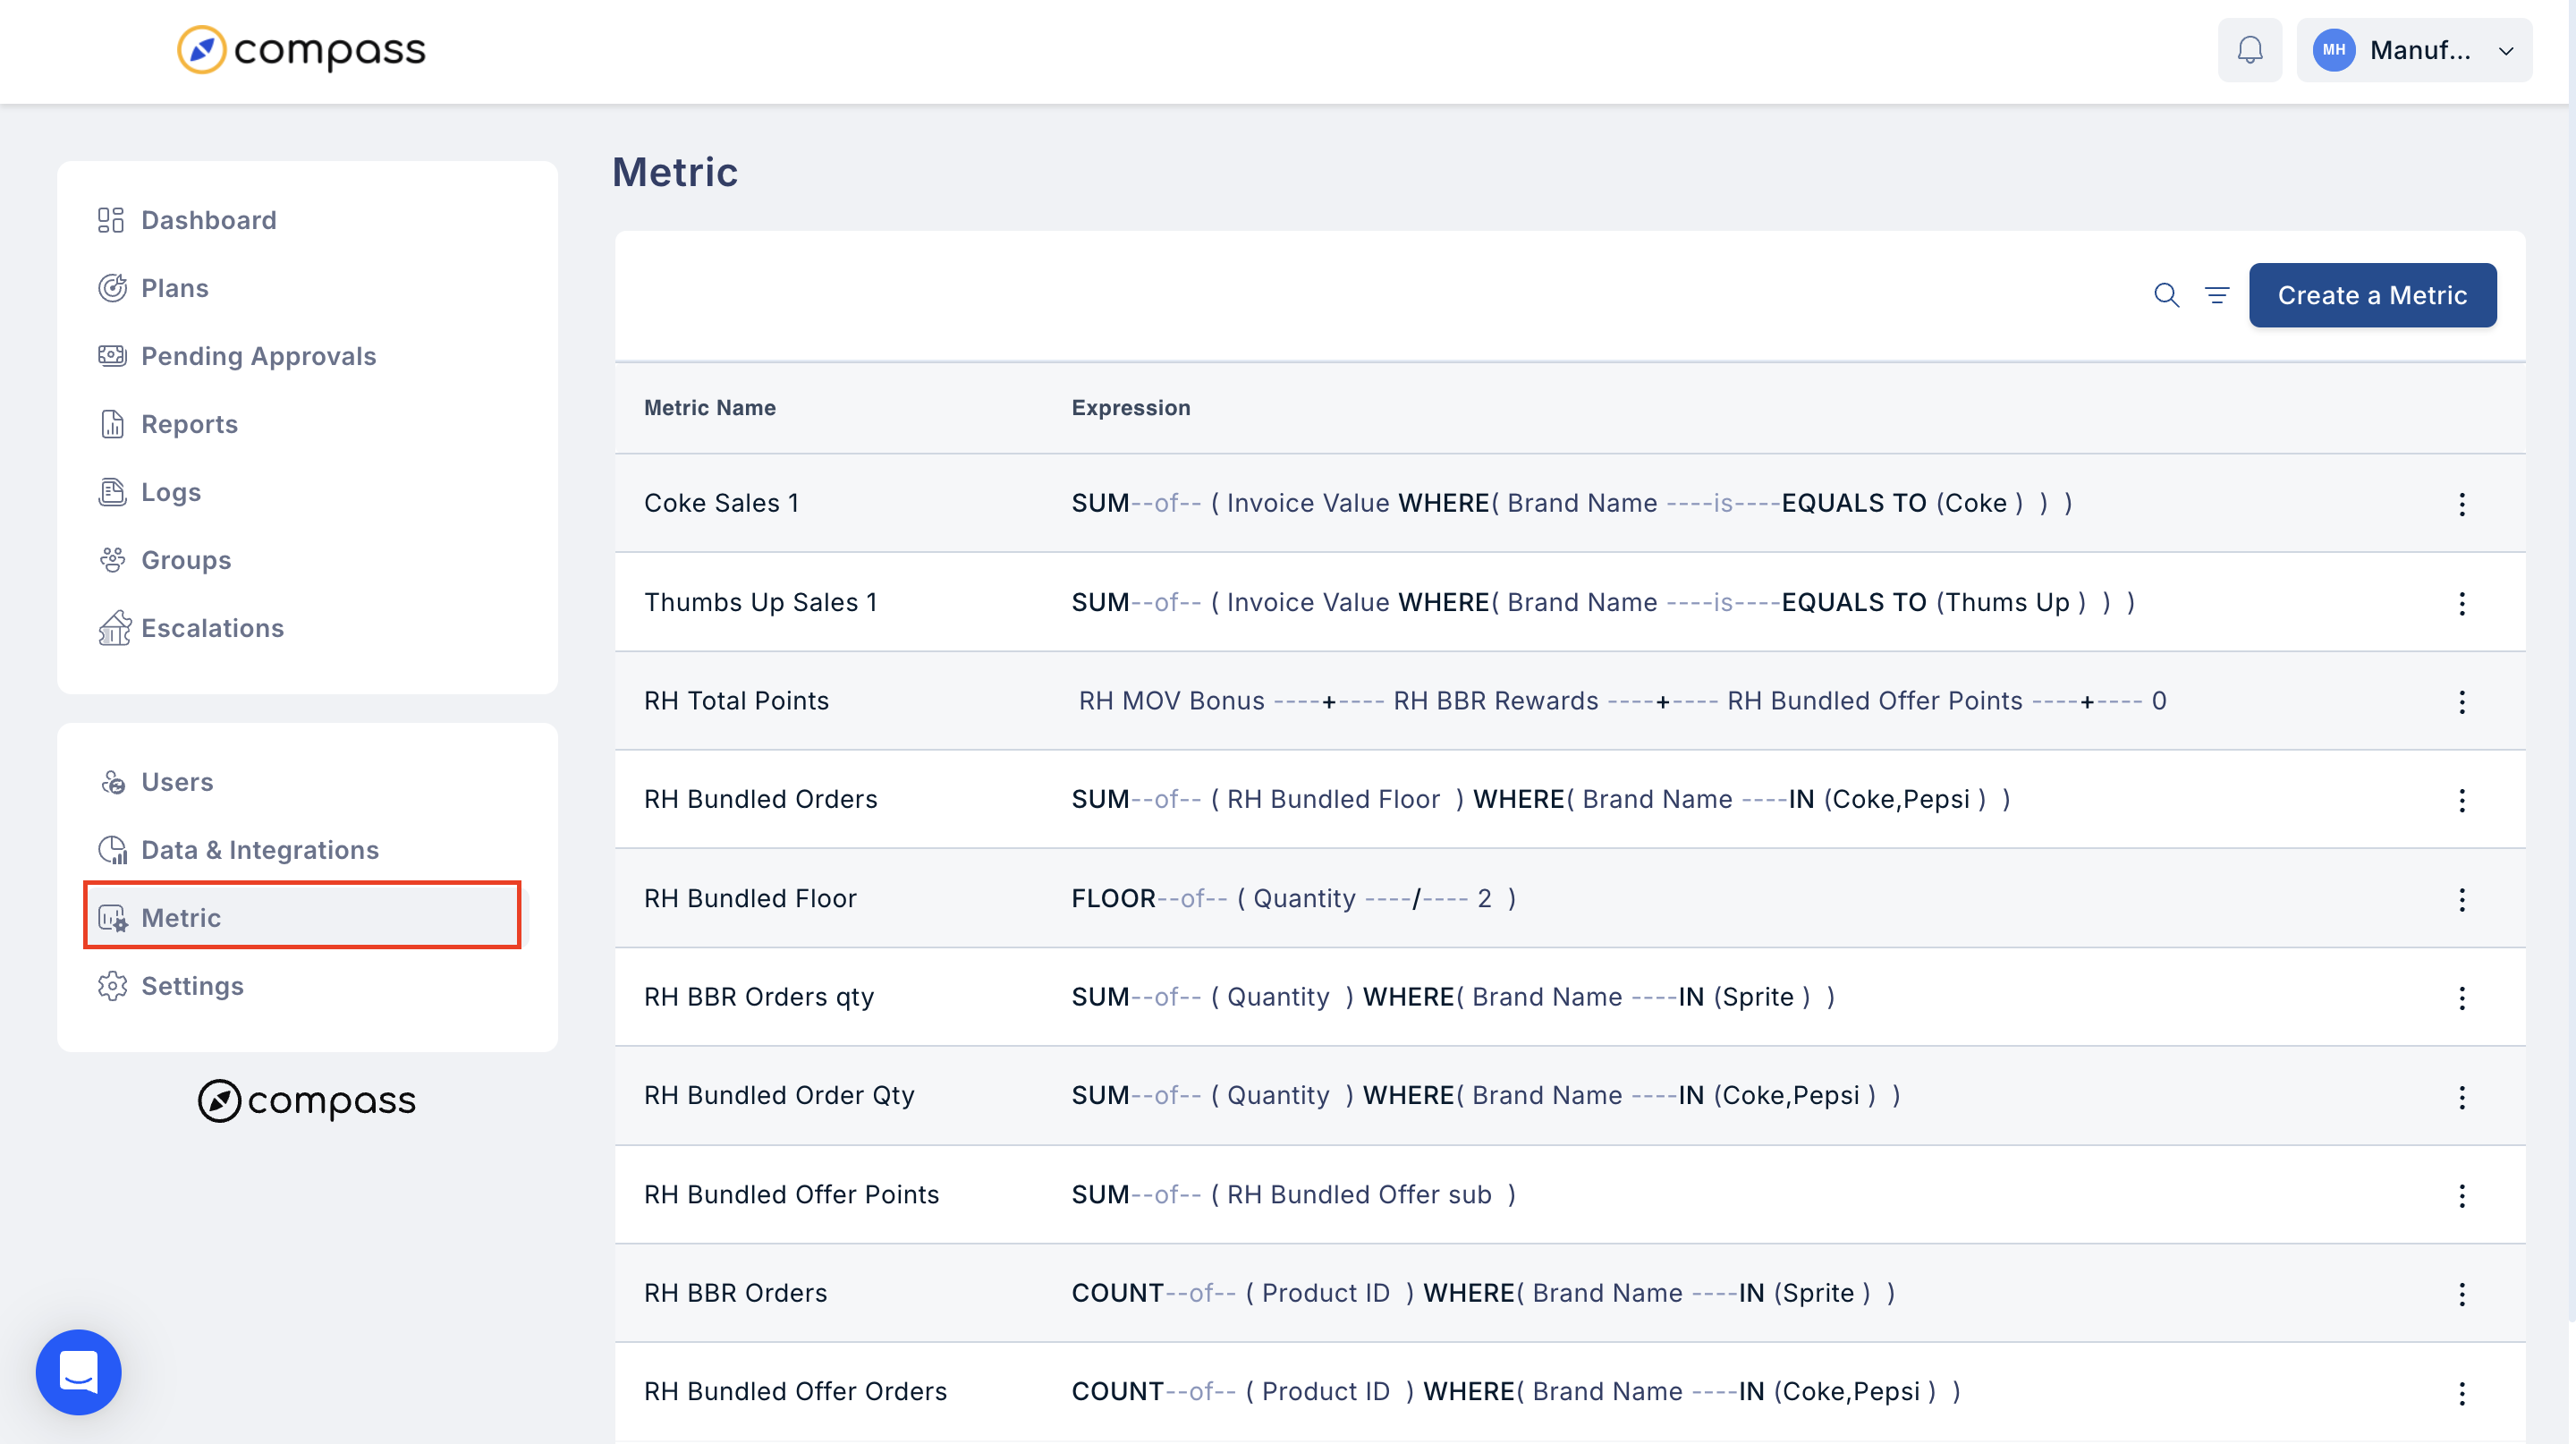
To access this feature, click on the ‘**Metric**’ in the admin main menu on the left side of the home page.
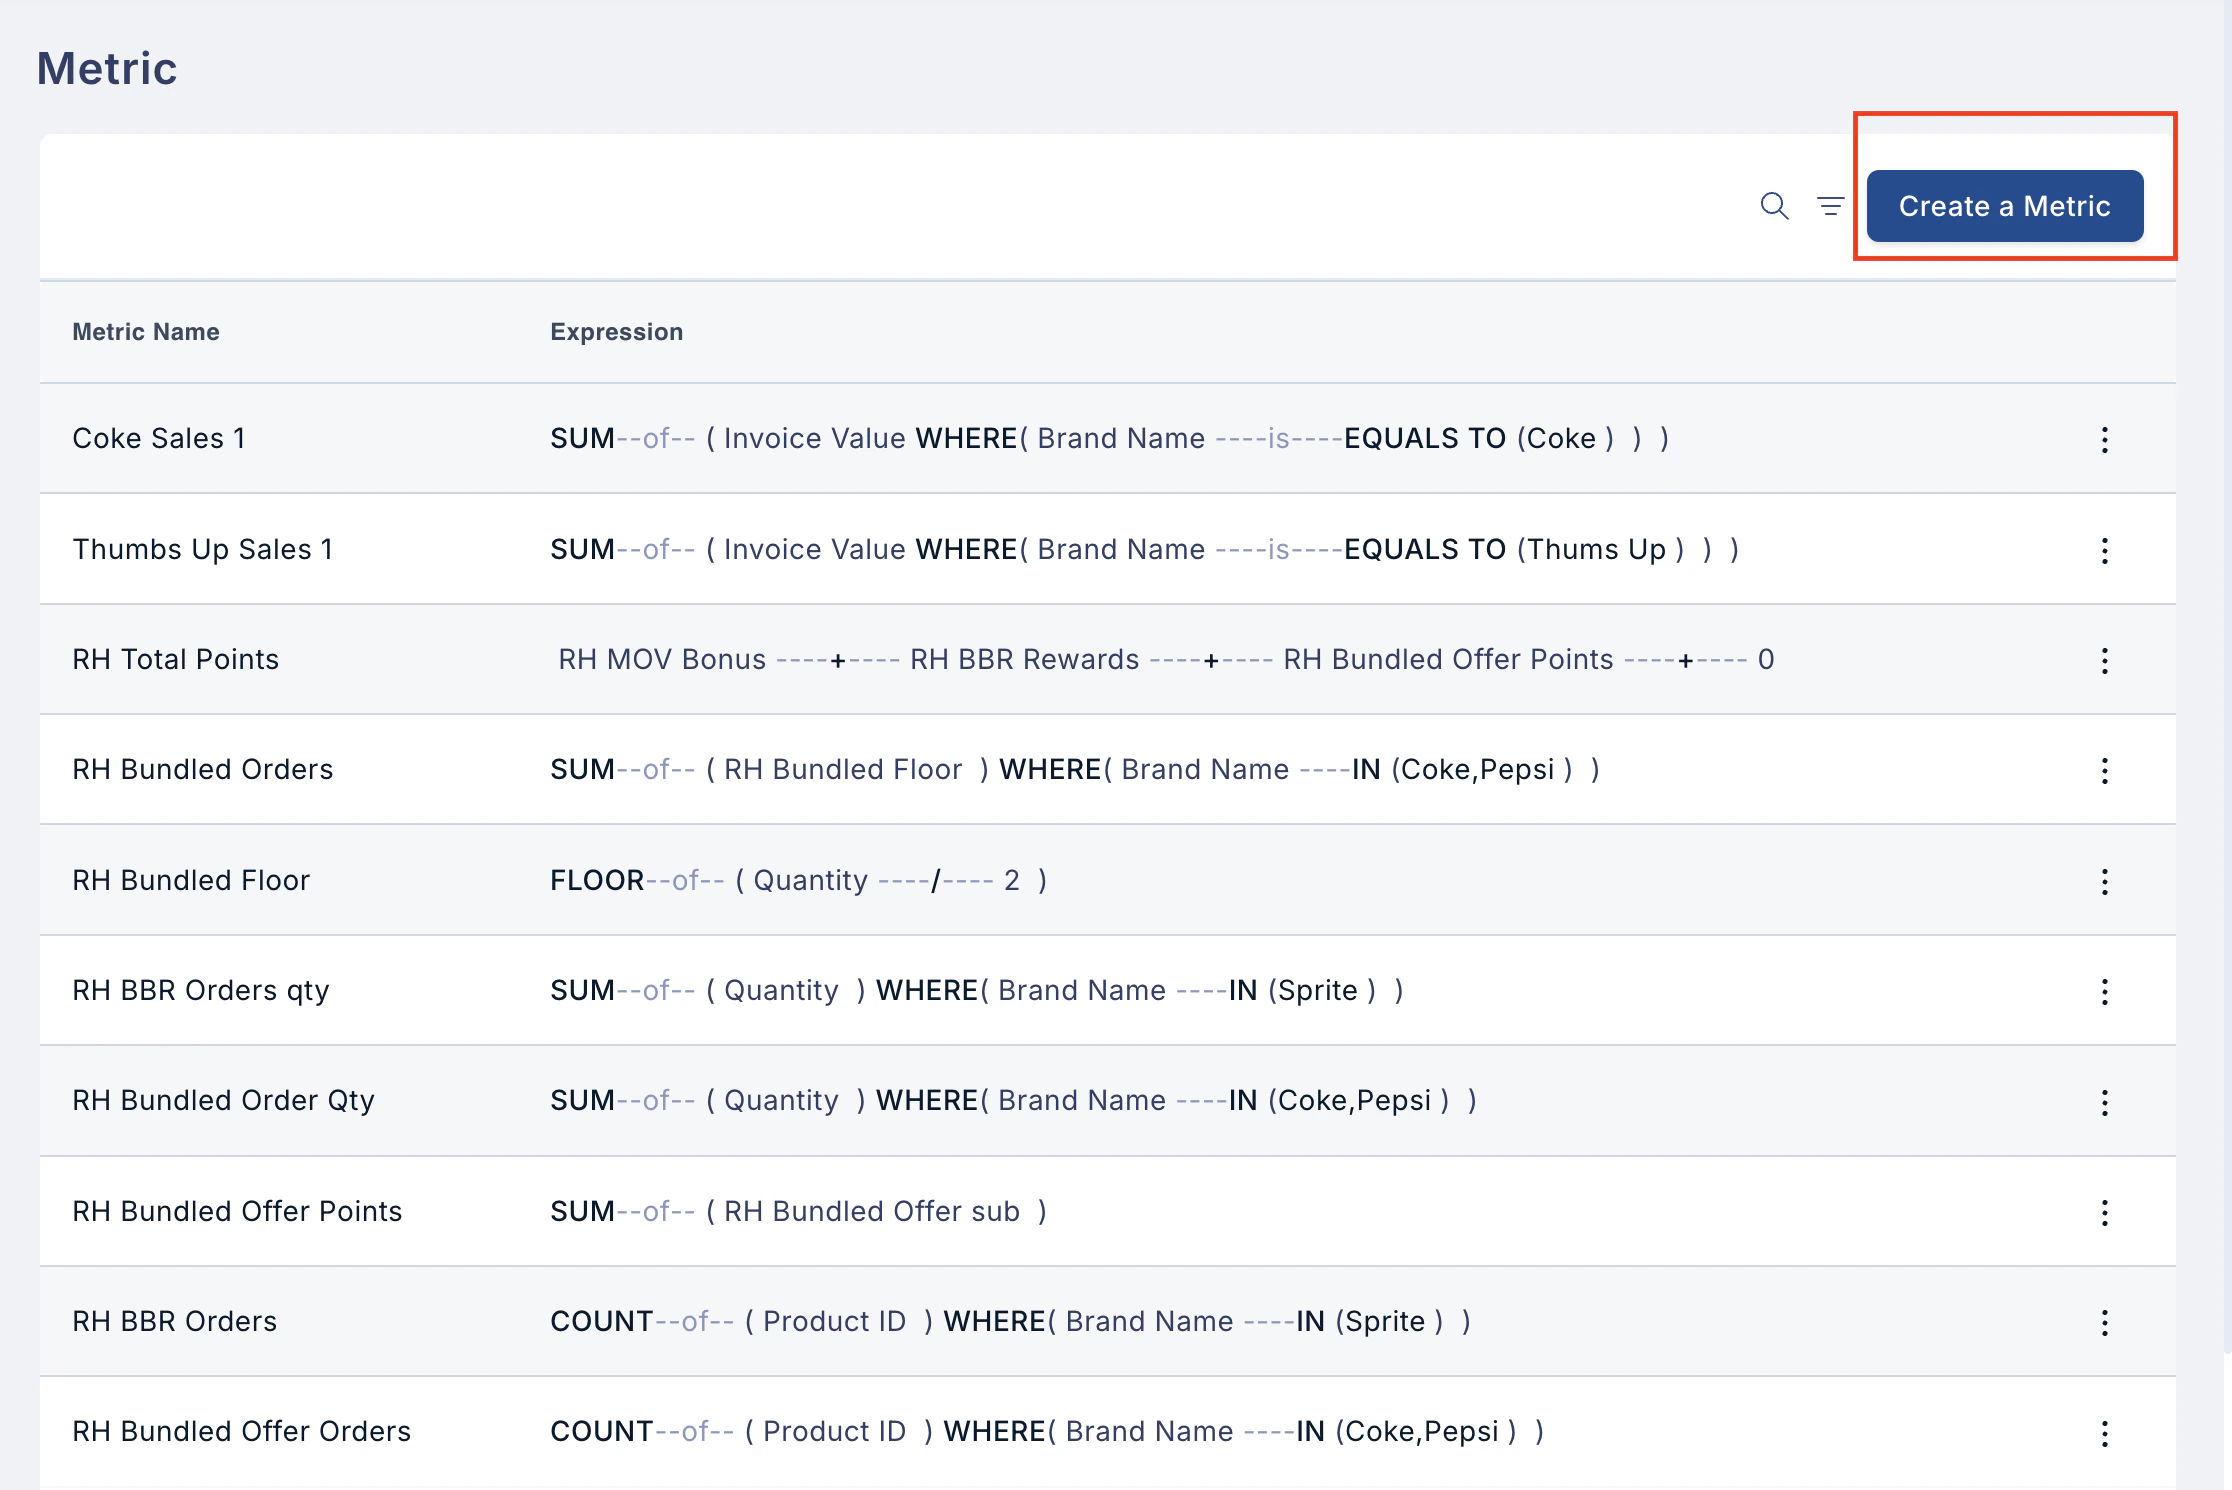
 New metrics can be created using the **"Create a Metric"** option at the top right corner of the screen.
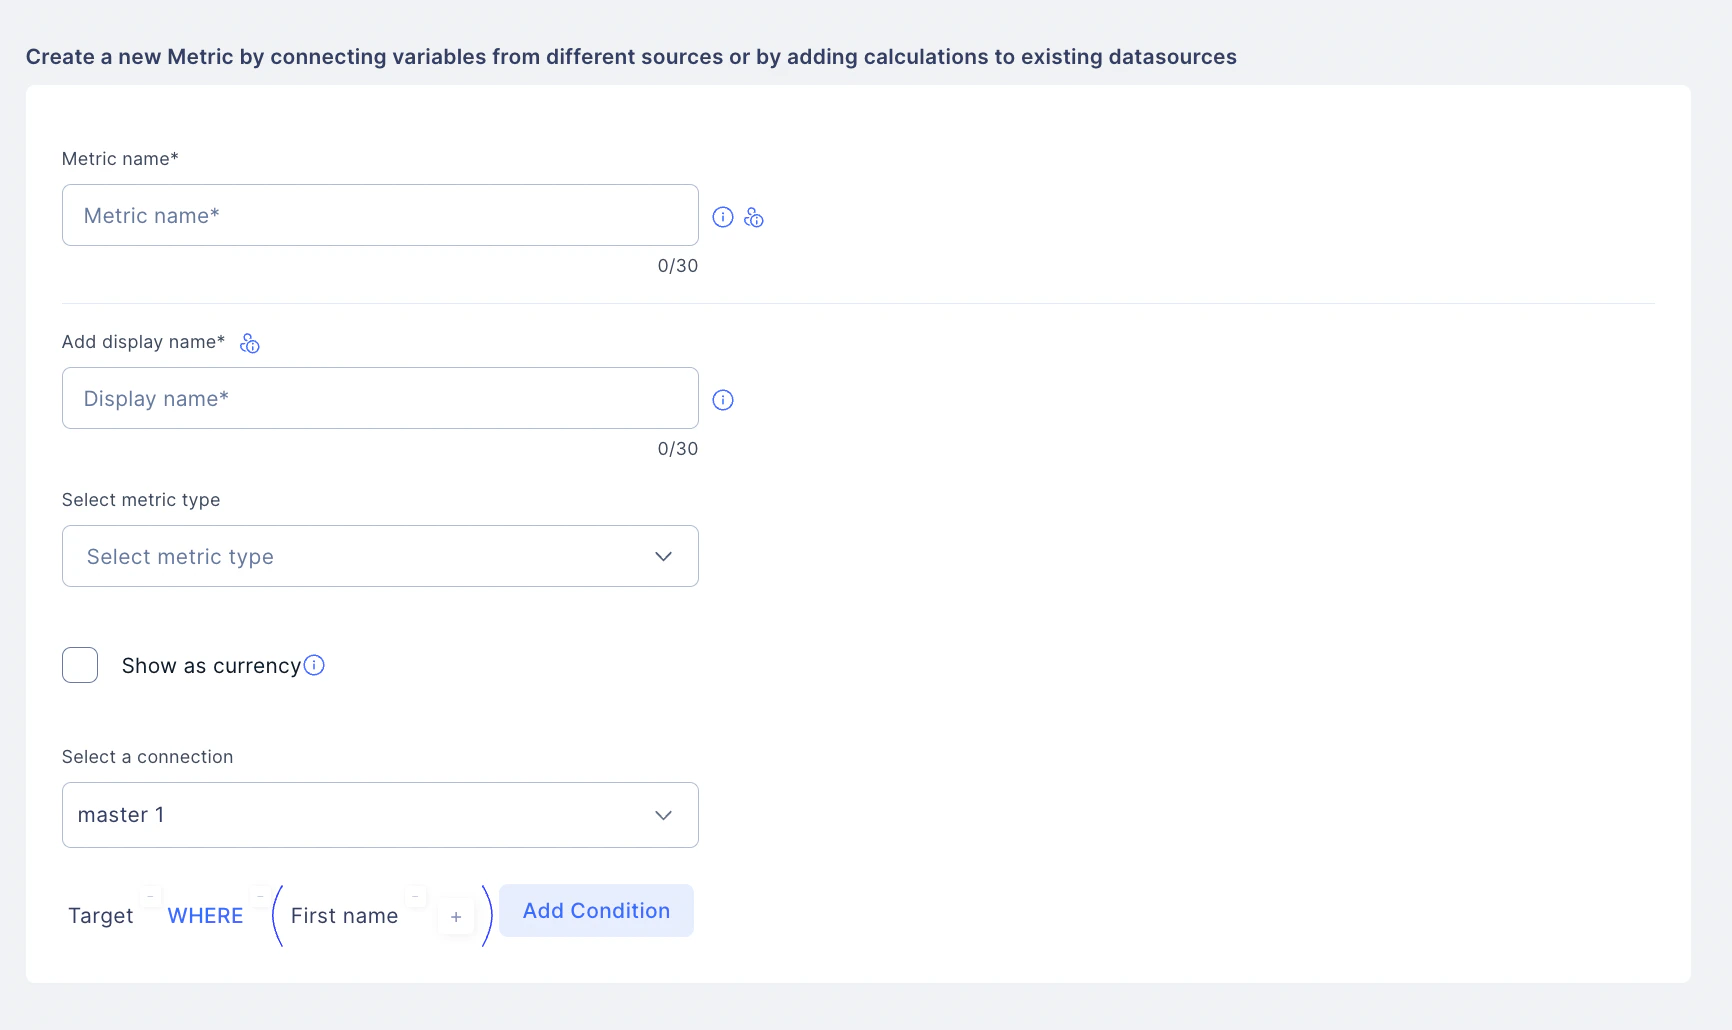
 Details such as the metric's name, Metric Display Name and select the Metric type using the drop down menu.
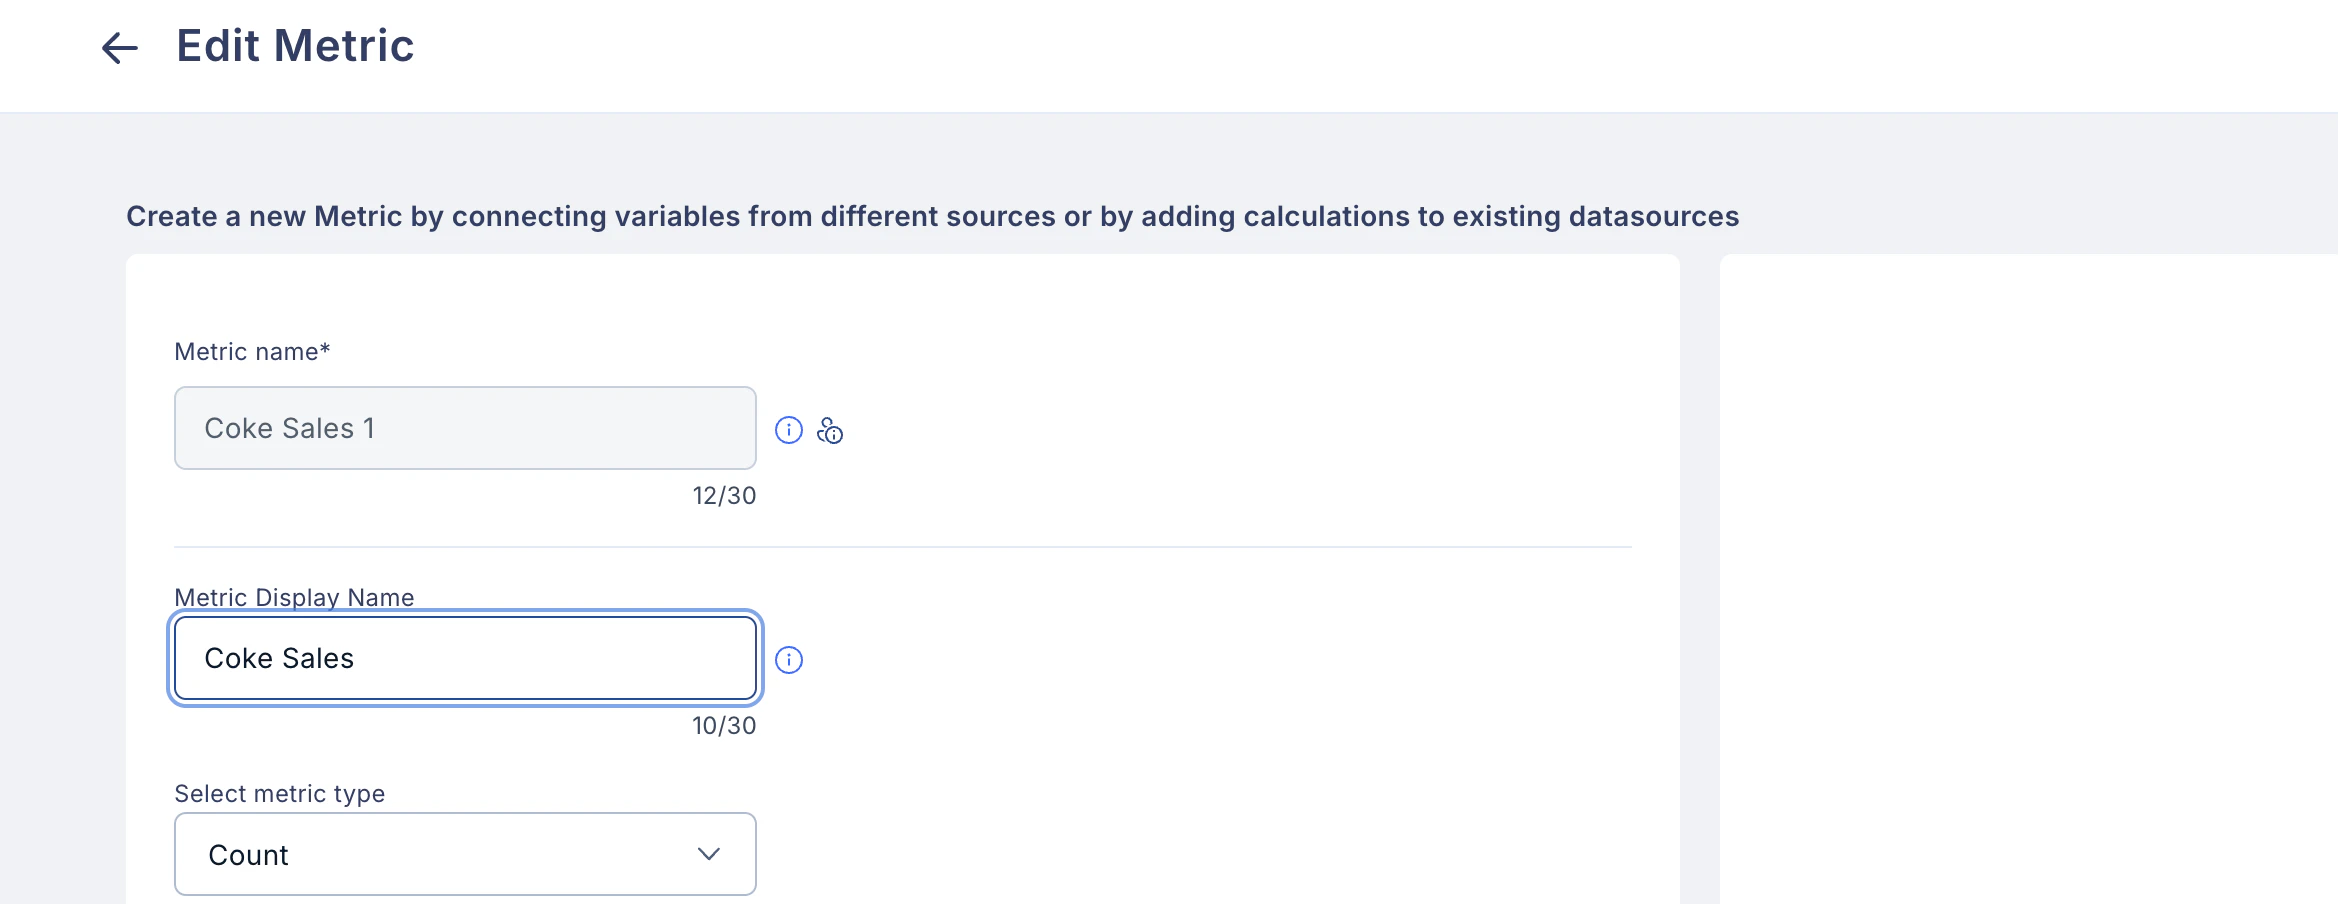 The following metric types are available:
* **Sum**
* **Count**
* **Percentage**
* **Min**
* **Max**
* **Average**
* **Count-distinct**
The following metric types are available:
* **Sum**
* **Count**
* **Percentage**
* **Min**
* **Max**
* **Average**
* **Count-distinct**
 * **Show as currency**:
Check this box to display metric values with a currency symbol.
* **Convert null entries to zero**:
Check this box to treat all null values as zero.
*Note:* This may significantly increase plan processing time as all nulls will be included in the calculations.
* **Show as currency**:
Check this box to display metric values with a currency symbol.
* **Convert null entries to zero**:
Check this box to treat all null values as zero.
*Note:* This may significantly increase plan processing time as all nulls will be included in the calculations.
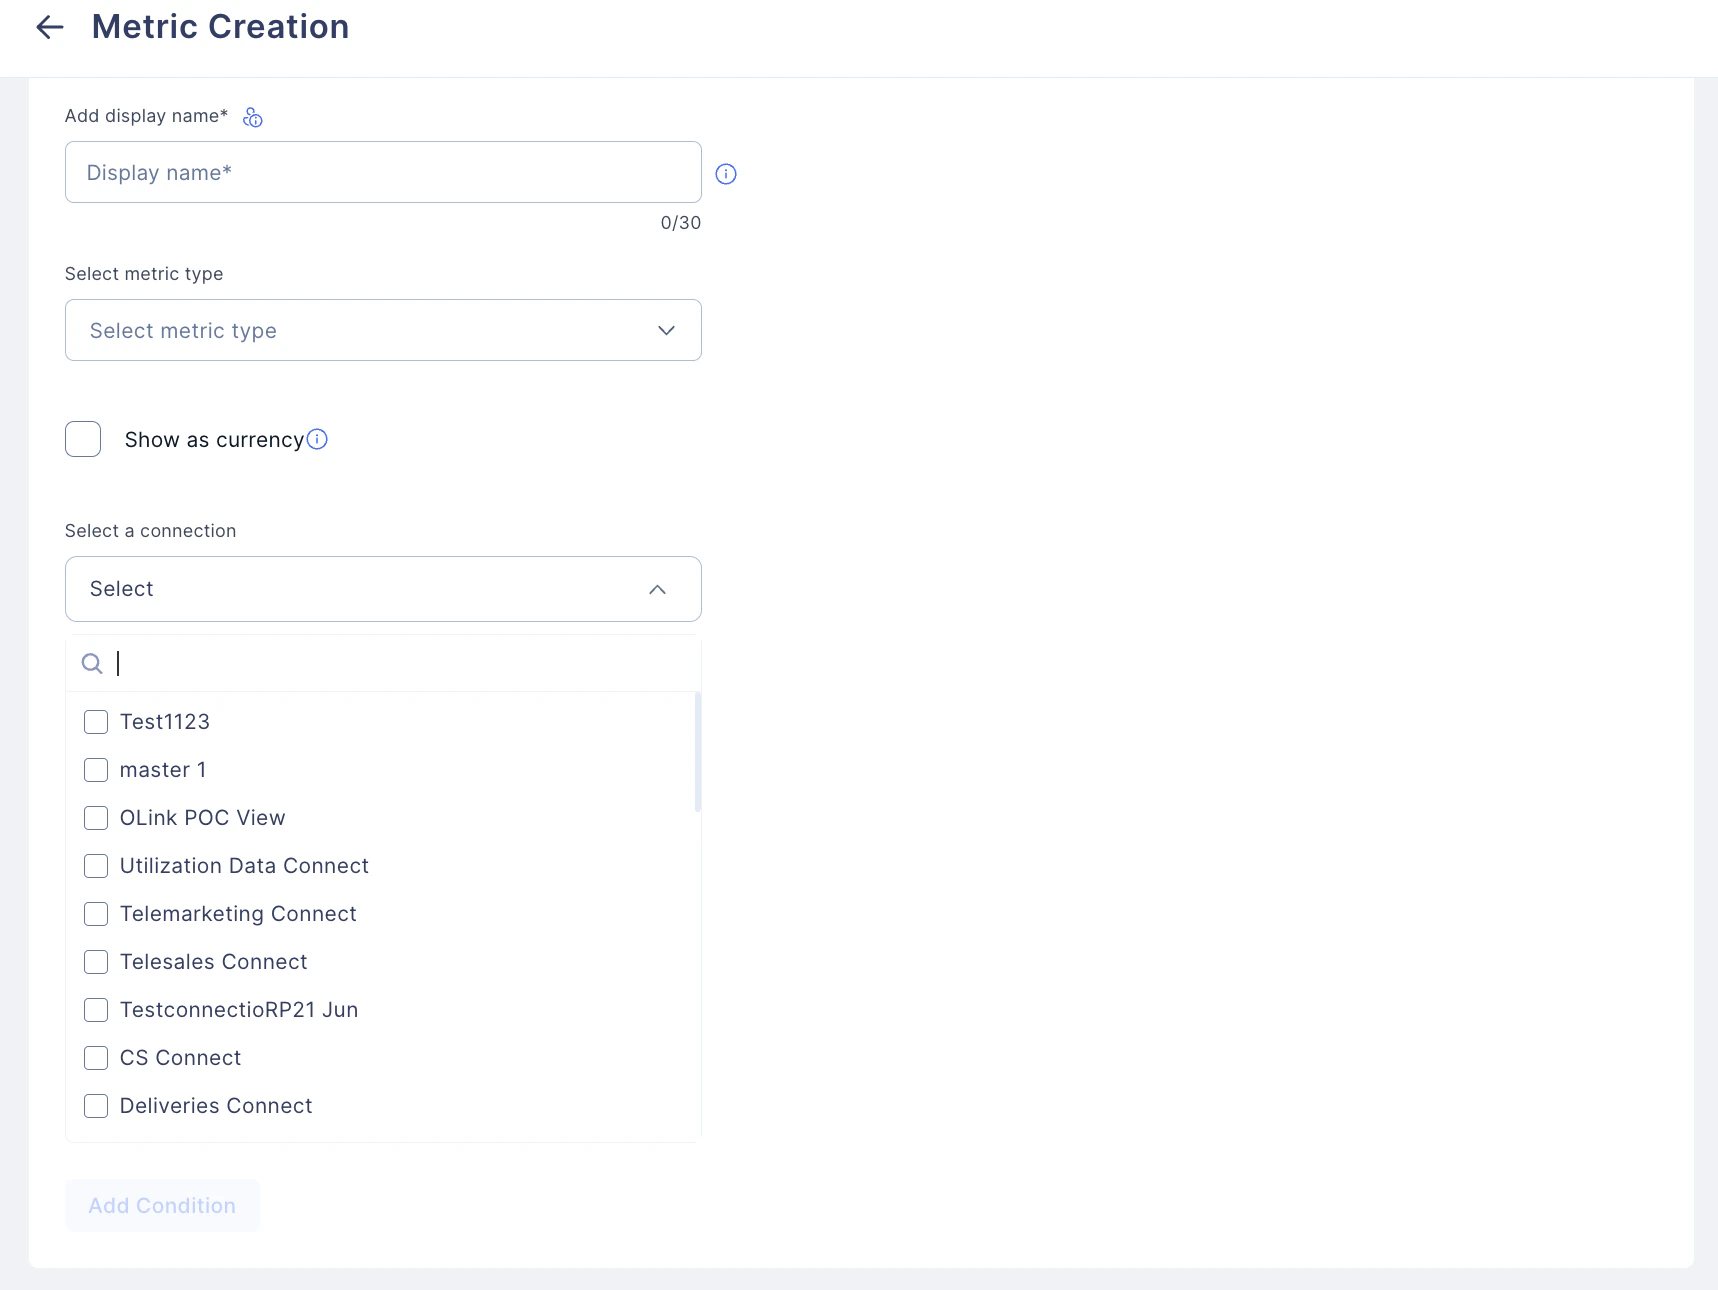
 5.1 Use the drop-down menu to select a connection (any Plan/Table/Metric) to add conditions. Metrics can be created from 10 data sources. This allows admins to capture complex logic without creating more number of metrics.
 5.2 **Add a Condition**
* Under conditions, the admin has to enter **field, function**, **metric,** and **static data** to create a condition for the particular metric.
5.2 **Add a Condition**
* Under conditions, the admin has to enter **field, function**, **metric,** and **static data** to create a condition for the particular metric.
 **5.2.1 Field**
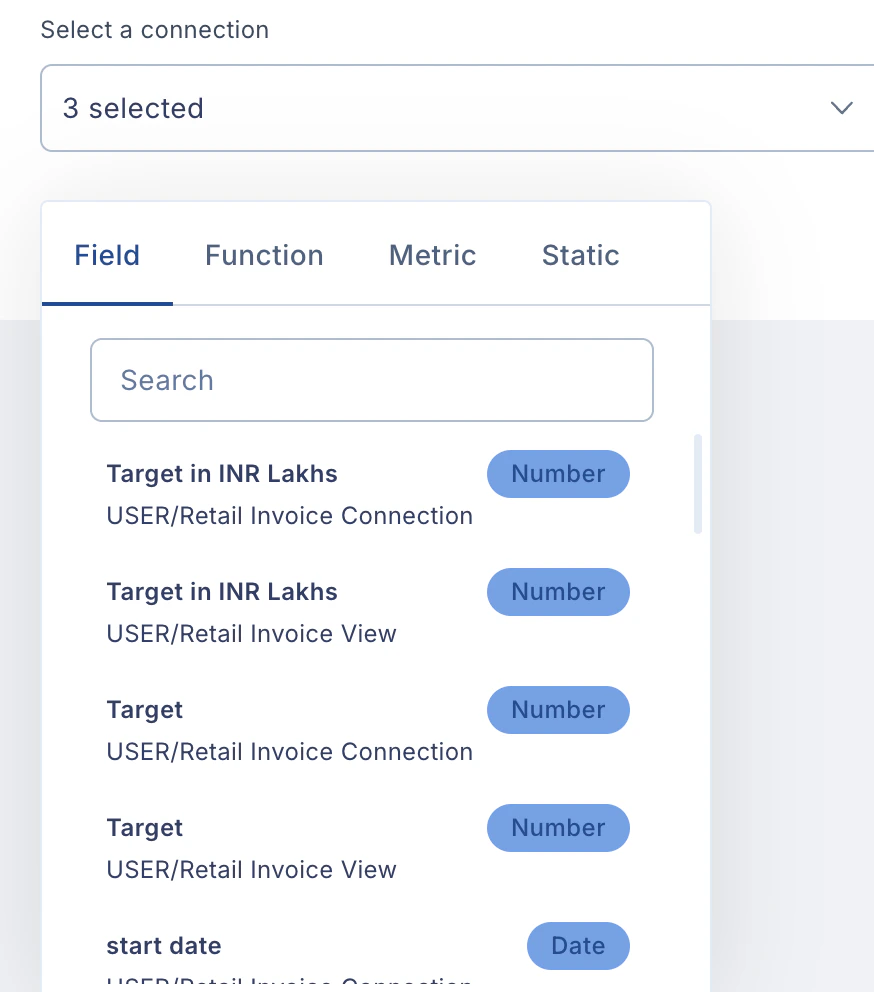
Like under **Field,** we can select the output of connection (Milestone-Reward/Score) or Headers of a Table, which comes from the **connection** we select.
**5.2.1 Field**
Like under **Field,** we can select the output of connection (Milestone-Reward/Score) or Headers of a Table, which comes from the **connection** we select.
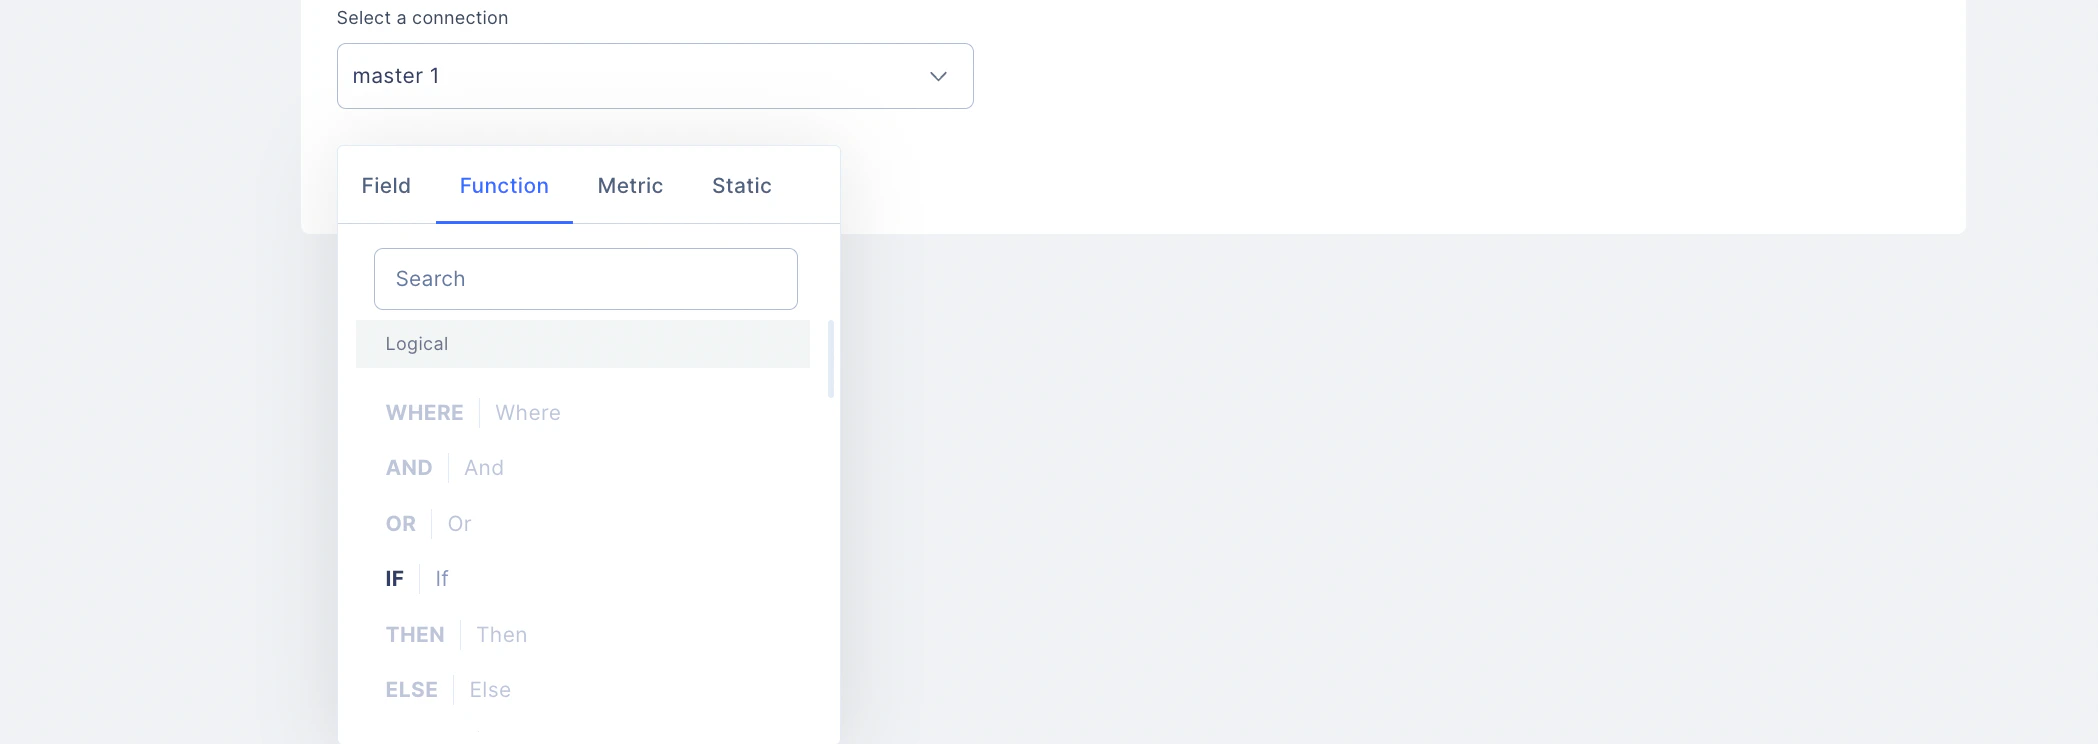
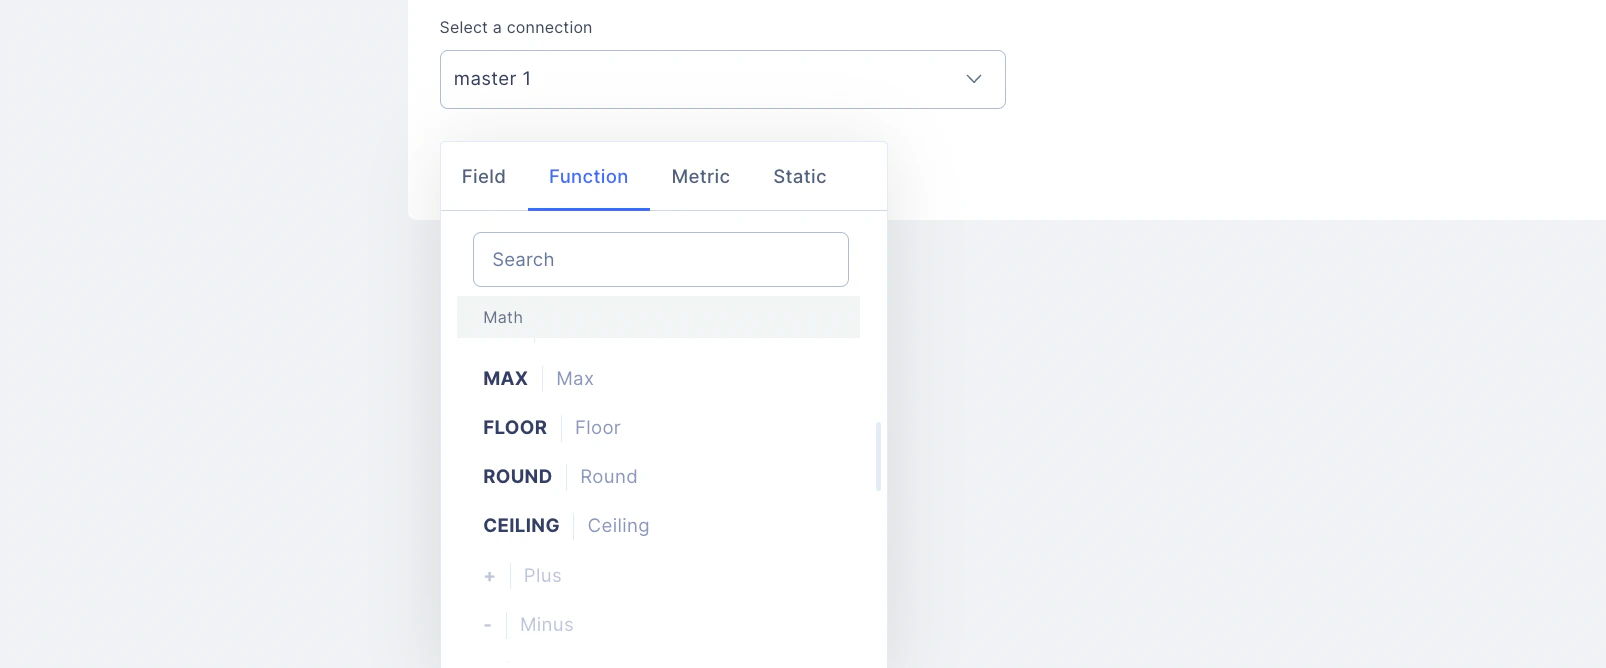
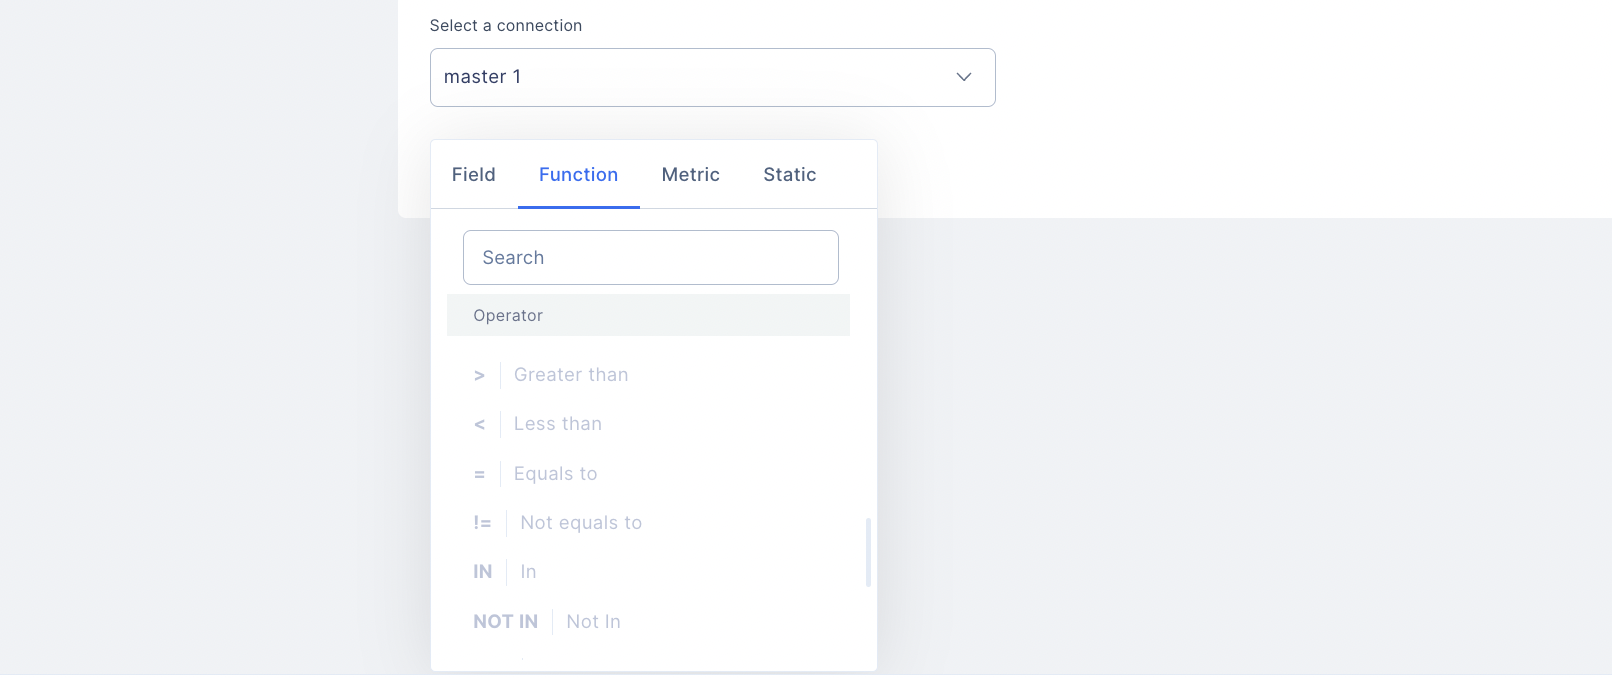
 **5.2.2 Function**
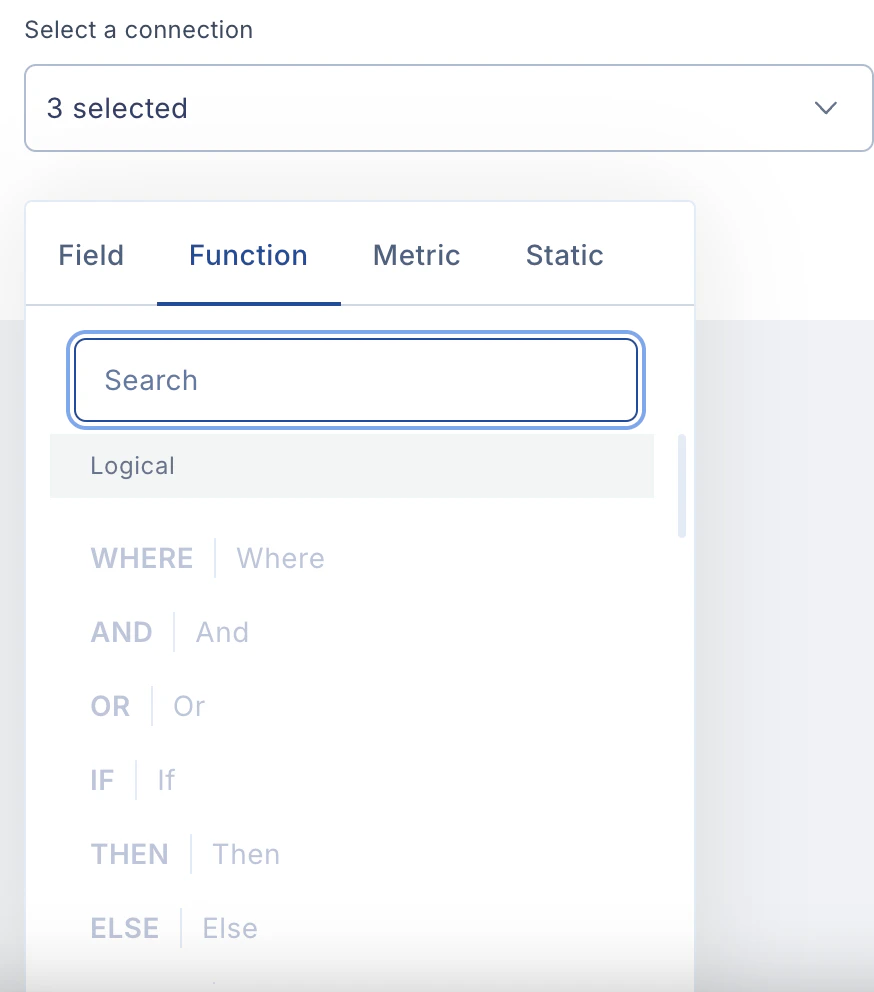
We can also include functions to define the criteria. Under functions, we have:
* Logical functions
**5.2.2 Function**
We can also include functions to define the criteria. Under functions, we have:
* Logical functions
 * Mathematical functions
 * Operators
 * Further, an aggregate function performs a calculation on multiple values and returns a single value. Platform provides many aggregate functions, including average, count, sum, min, max, etc. An aggregate function ignores NULL values when it performs the calculation, except for the count function.
* The **GROUP BY** function groups rows with the same values. Optionally, it is used in conjunction with aggregate functions to produce summary reports from the data. **WHERE** is used to extract only those records that fulfill a specified condition.
* The **AND** operator records whether all the conditions separated by AND are TRUE. The OR operator displays a record of whether any of the conditions separated by OR are TRUE.
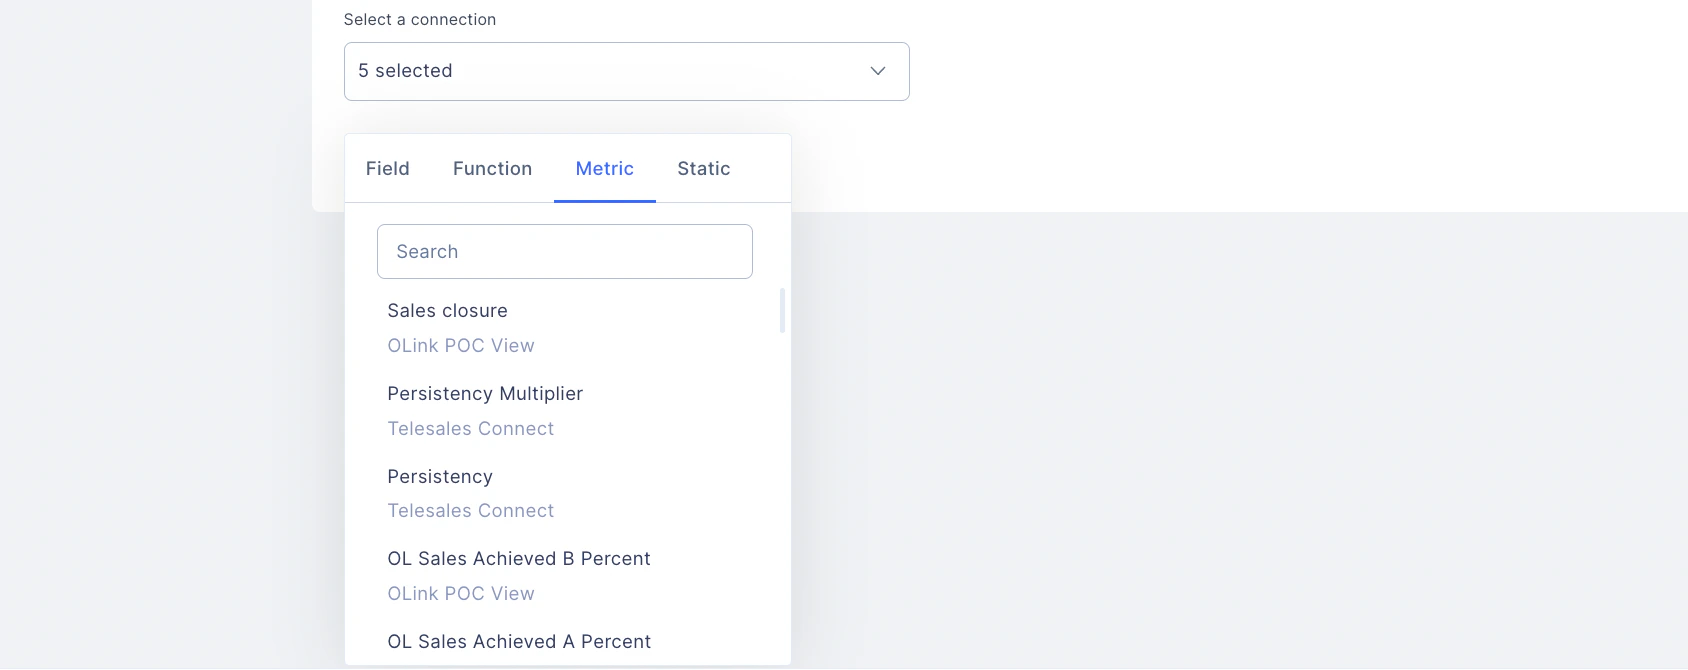
**5.2.3 Metric**
Under **the metric dropdown, we can see and use all the other relevant metrics that have already been** created using the sameconnection.
* Further, an aggregate function performs a calculation on multiple values and returns a single value. Platform provides many aggregate functions, including average, count, sum, min, max, etc. An aggregate function ignores NULL values when it performs the calculation, except for the count function.
* The **GROUP BY** function groups rows with the same values. Optionally, it is used in conjunction with aggregate functions to produce summary reports from the data. **WHERE** is used to extract only those records that fulfill a specified condition.
* The **AND** operator records whether all the conditions separated by AND are TRUE. The OR operator displays a record of whether any of the conditions separated by OR are TRUE.
**5.2.3 Metric**
Under **the metric dropdown, we can see and use all the other relevant metrics that have already been** created using the sameconnection.
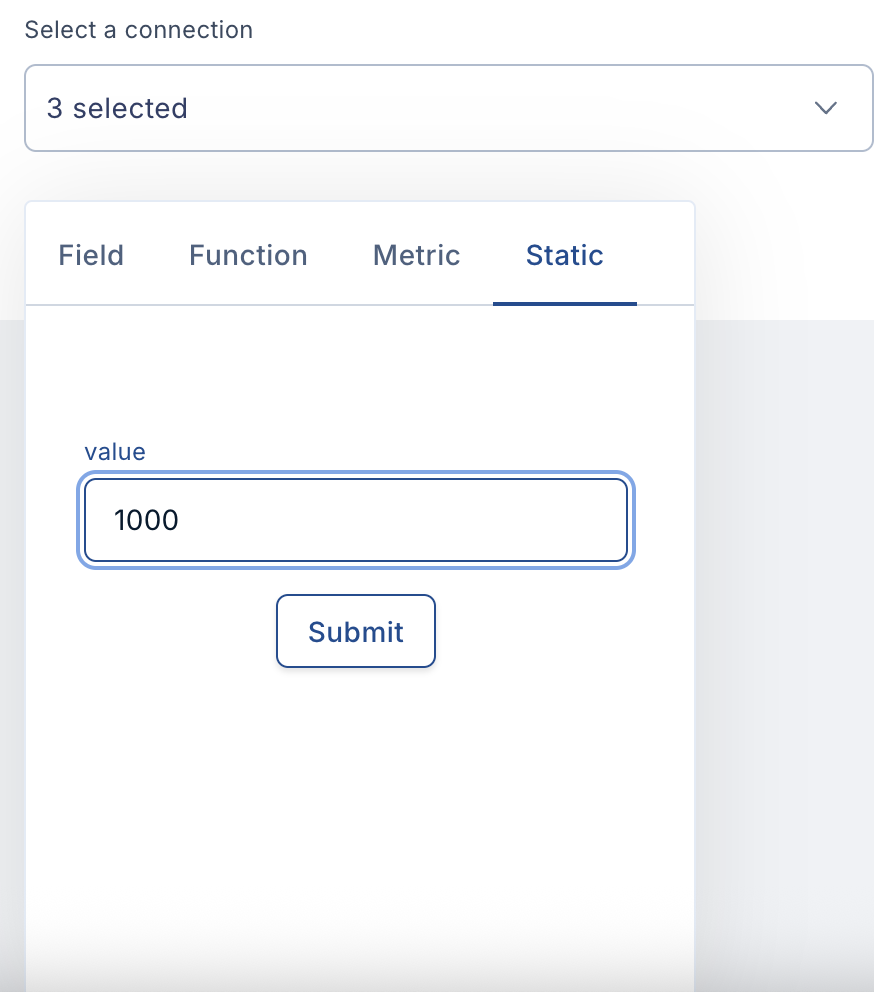
 **5.2.4 Static**
If a numerical value must be included in the calculation, we can use STATIC, where the required numerical value is added and submitted.
**5.2.4 Static**
If a numerical value must be included in the calculation, we can use STATIC, where the required numerical value is added and submitted.
 Once completed, click **"Save"** to complete the metric creation.
## Editing a Metric
Navigate to **Metrics**.
Locate and select the metric you wish to edit.
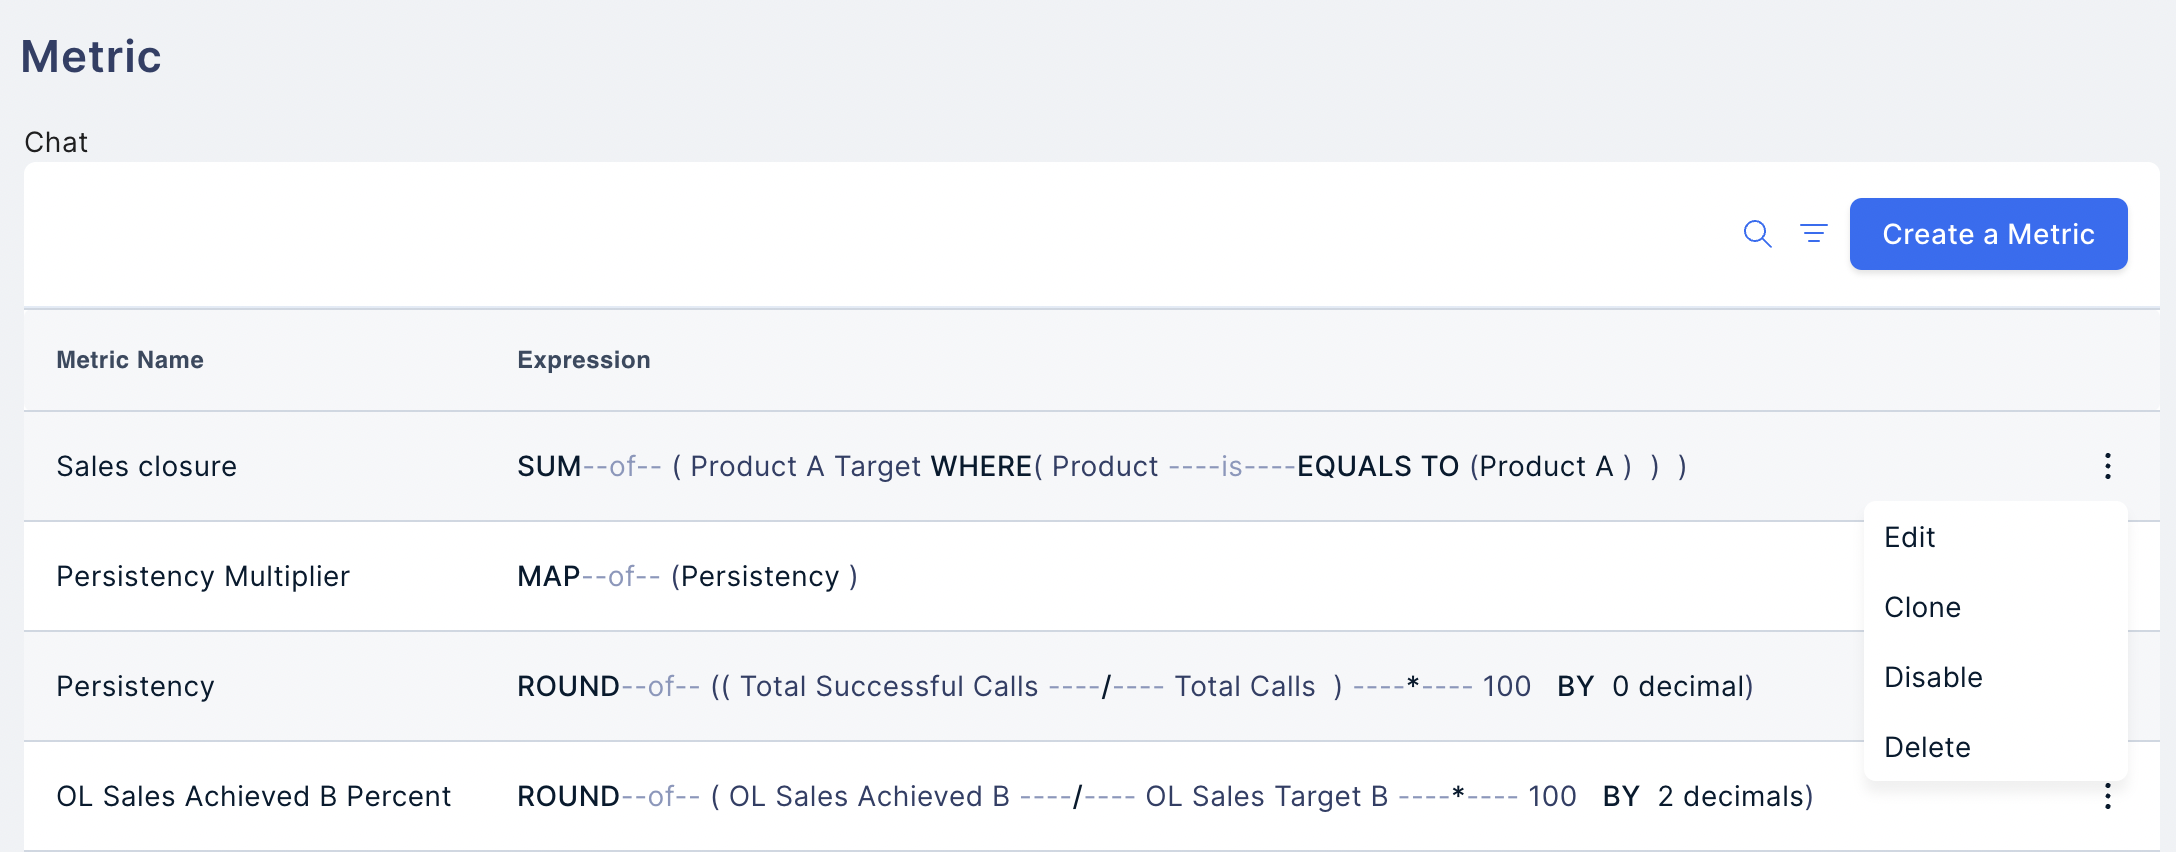
Click the **three dots** (⋮) icon next to the metric.
Select **Edit** from the dropdown menu.
Make changes and click **Update.**
Once completed, click **"Save"** to complete the metric creation.
## Editing a Metric
Navigate to **Metrics**.
Locate and select the metric you wish to edit.
Click the **three dots** (⋮) icon next to the metric.
Select **Edit** from the dropdown menu.
Make changes and click **Update.**
 ## Clone, Disable, and Delete a Metric
When we click the three dots, we can also Clone, Disable, and Delete options. A metric already used in any Plan must not be Edited, Disabled, or Deleted, as it can affect itsoutcome\*\*.\*\*
Need help? Reach out to your support team or [cs@xoxoday.com](mailto:cs@xoxoday.com).
## Clone, Disable, and Delete a Metric
When we click the three dots, we can also Clone, Disable, and Delete options. A metric already used in any Plan must not be Edited, Disabled, or Deleted, as it can affect itsoutcome\*\*.\*\*
Need help? Reach out to your support team or [cs@xoxoday.com](mailto:cs@xoxoday.com).