> ## Documentation Index
> Fetch the complete documentation index at: https://help-empuls.xoxoday.com/llms.txt
> Use this file to discover all available pages before exploring further.
# Dashboard
> Overview of different widgets on the dashboard
## **Overview**
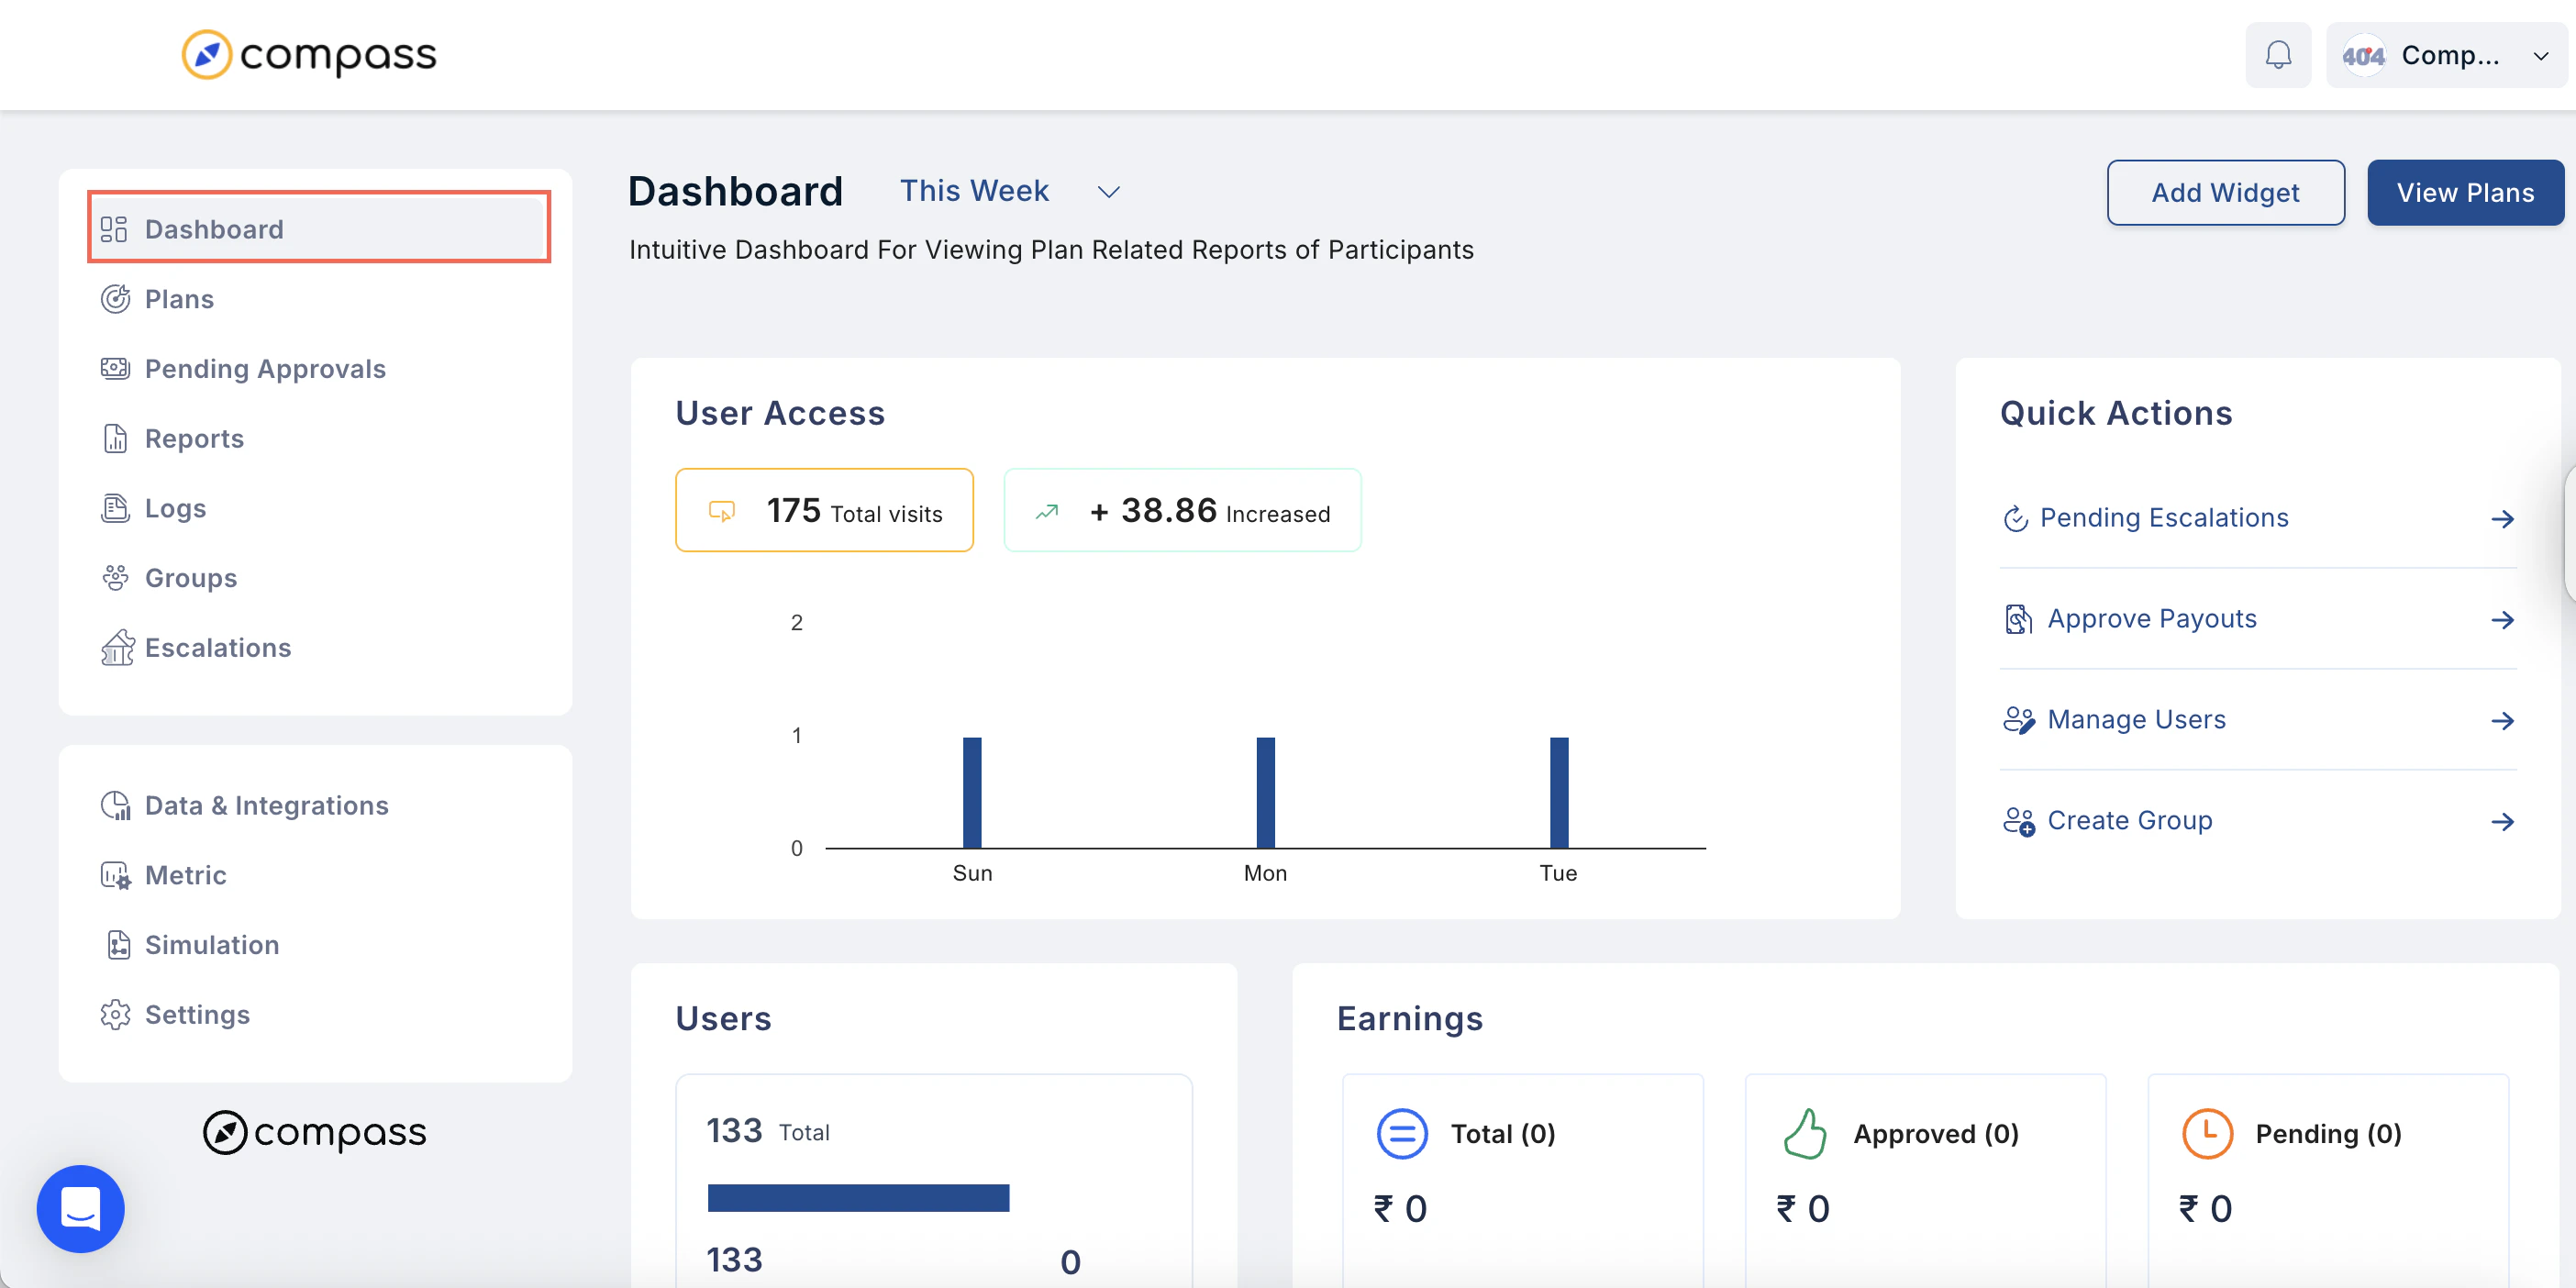
The dashboard provides administrators with a unified view of all key program metrics, user activity, and plan performance. Each widget is fully customizable to match your organization’s incentive structure, enabling you to monitor engagement, track payouts, evaluate ROI, and analyze sales trends in real time.
Once your account is onboarded, the dashboard will be tailored to your specific plan requirements. If you need access to additional insights or custom elements, our tech team can quickly enable them for you.
[Video - Dashboard Overview](https://app.supademo.com/demo/clyidgqfw00qvphh0nf1xy159?preview=true)
If you need visibility into certain plan elements, you can contact our tech team, and they'll set it up for you quickly.
 ## Dashboard Widgets Overview
1. ## User Access
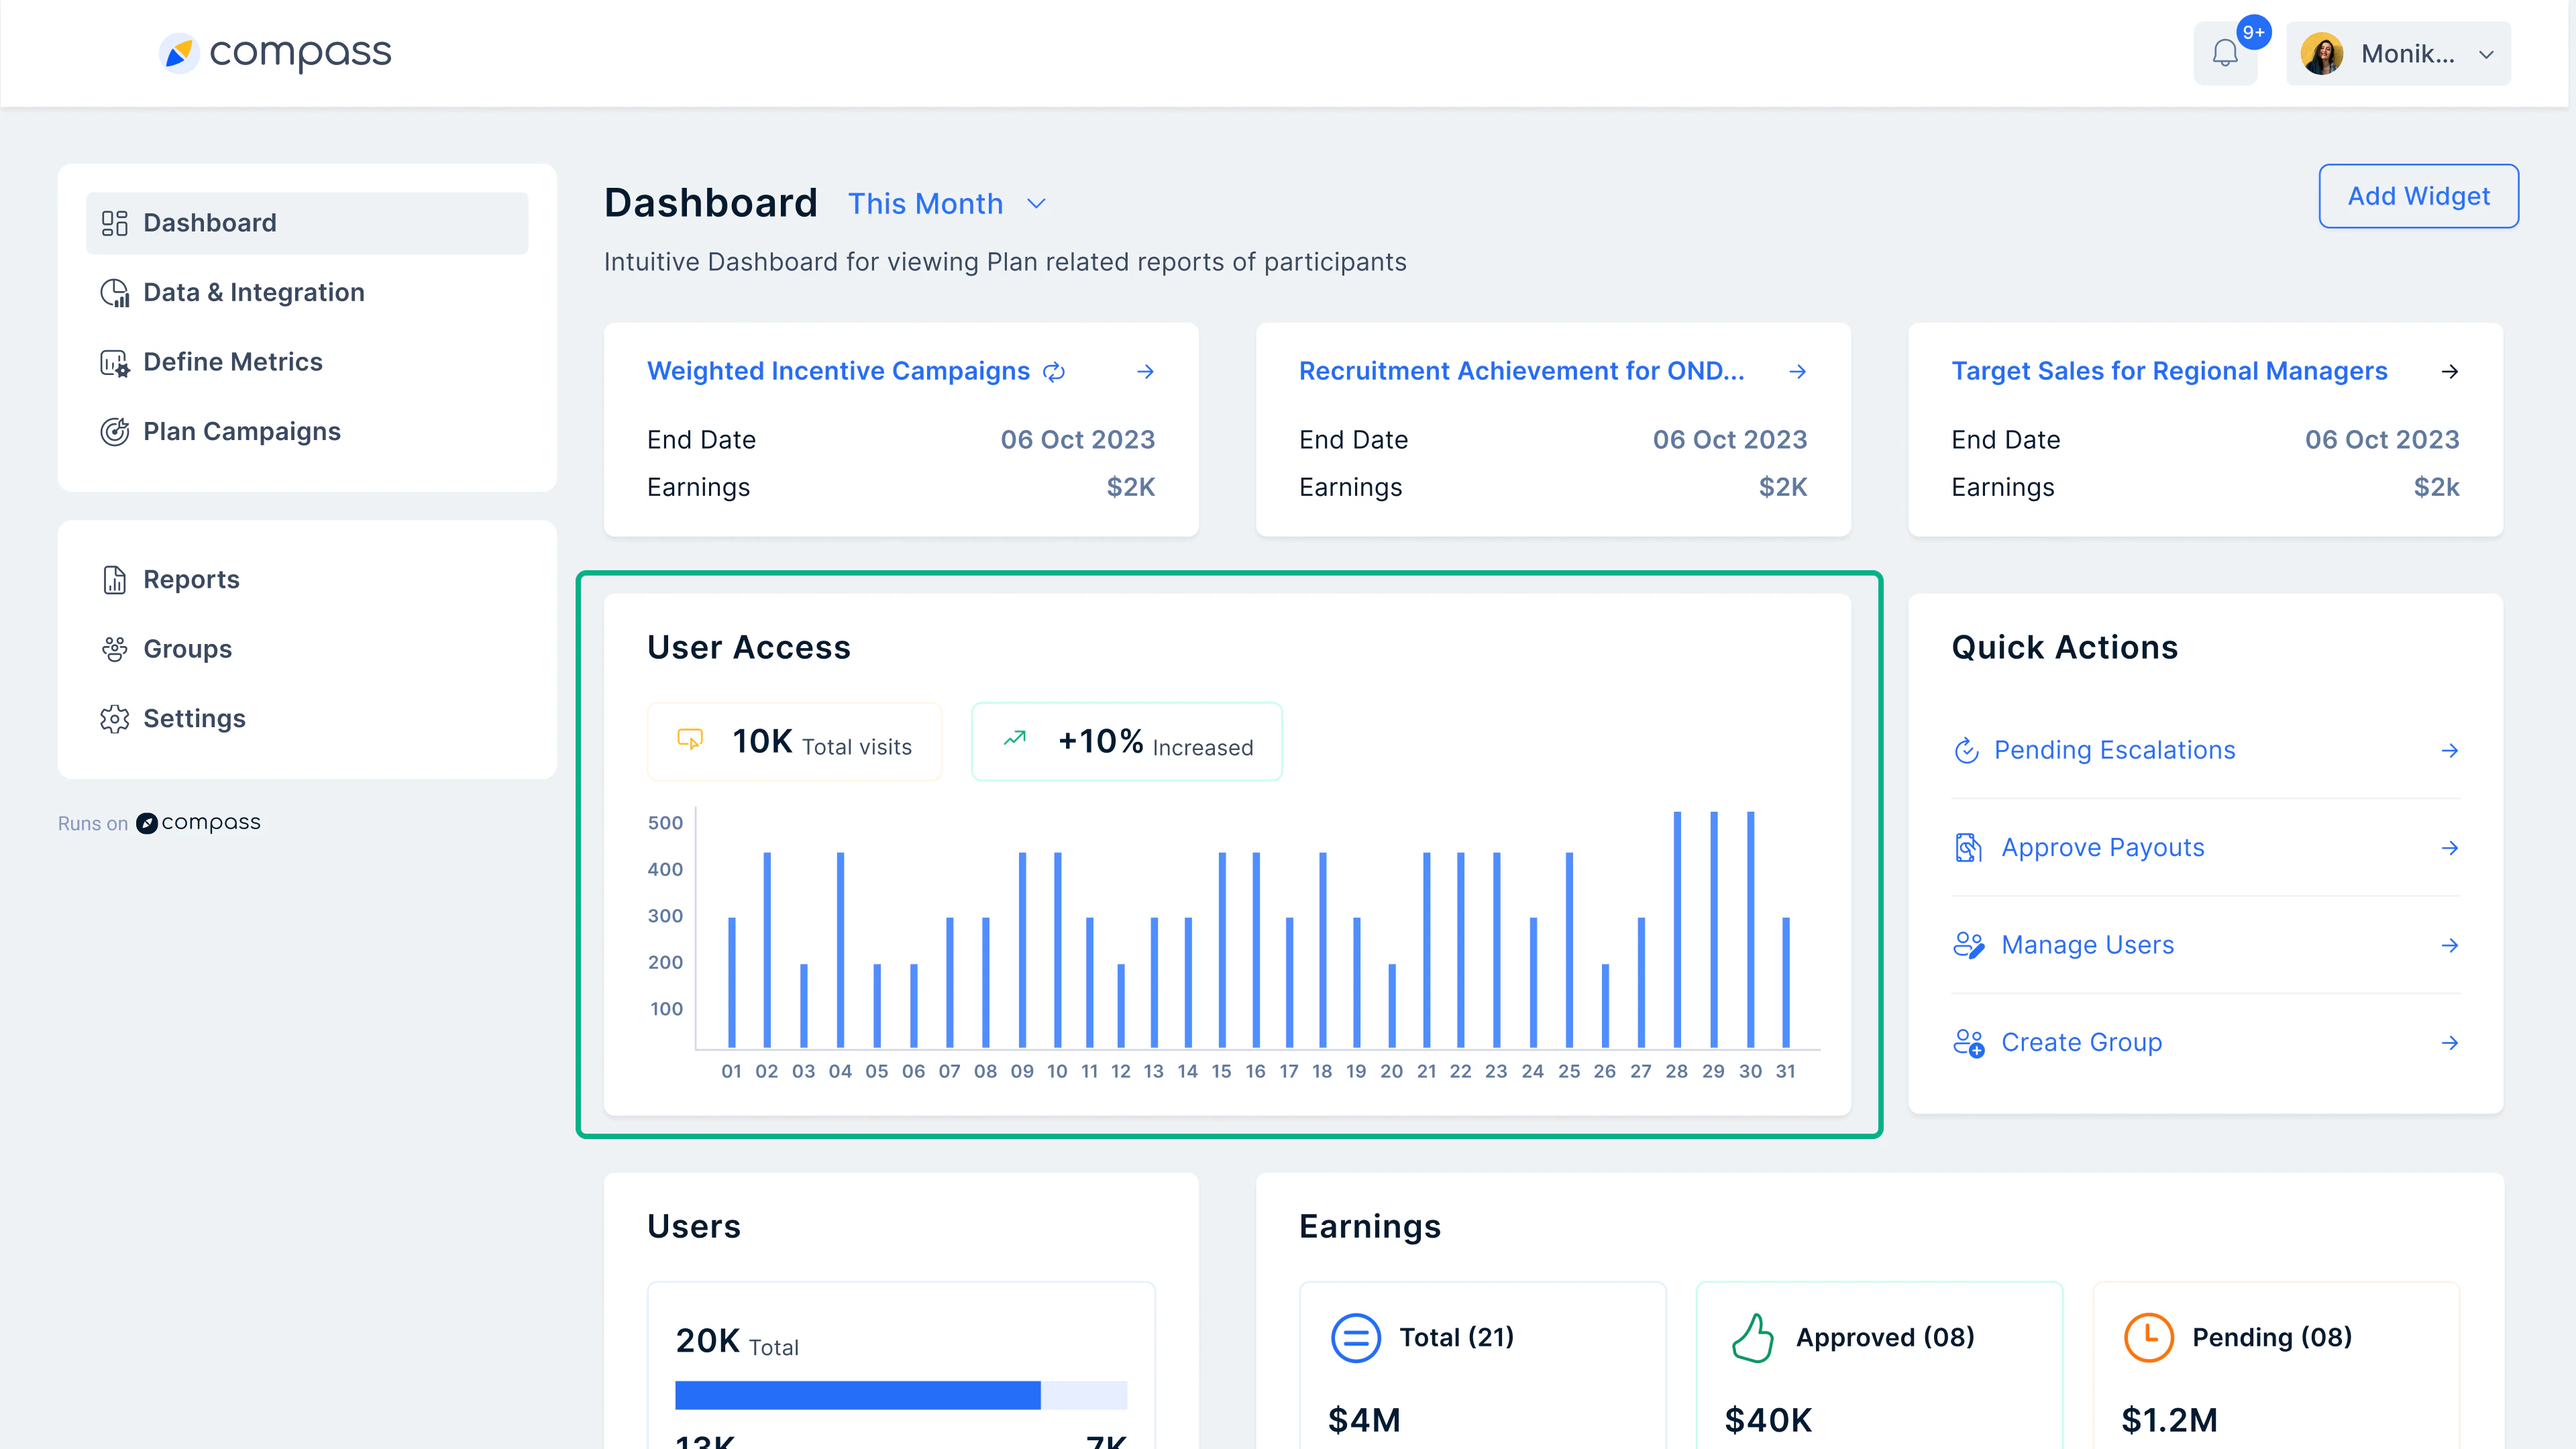
This widget shows how many users have visited the web or mobile app within a selected timeframe. It helps you track user engagement and understand the overall reach of your incentive program.
## Dashboard Widgets Overview
1. ## User Access
This widget shows how many users have visited the web or mobile app within a selected timeframe. It helps you track user engagement and understand the overall reach of your incentive program.
 ## 2. Quick Actions
Quick Actions allow you to easily navigate essential features —such as approval payouts, user management, group creation, and more.
You can customize the available actions based on the needs of each plan.
## 3. Users and Quota
The **Users** section displays who has achieved at least one milestone (*Eligible*) and who has not achieved any (*Not Eligible*).
The **Quota** section shows the overall quota achievement for each user.
## 4. Earnings
This view summarizes total user earnings, along with payouts that are pending approval or require rejection based on plan rules.
**Quick explainer video:**
[https://app.supademo.com/demo/clyctc6ry0l0xthf76rd95zyo?preview=true](https://app.supademo.com/demo/clyctc6ry0l0xthf76rd95zyo?preview=true)
## 5. Performance report
It provides a snapshot of users' performance across plans. You can customize it according to your needs, such as whether you want to see the performance of a particular plan or a specific set of users.
## 6. Metric vs Plans
This widget gives administrators a clearer understanding of plan ROI by comparing performance across selected KPIs.
It offers a comprehensive view of how different plans are performing relative to each other. You can tailor the comparison by selecting specific plans or metrics.
## 7. Plan payout trends
This view highlights how payouts are being distributed—monthly, quarterly, or yearly.
It also flags unusual trends so you can stay proactive and maintain payout accuracy.
## 8. Investment vs Revenue Generation
Understand your ROI by comparing your organization’s incentive or commission spend (plan budgets) with the revenue generated by your sales teams.
## 9. Product Sales Trends
This widget highlights patterns and shifts in product performance over time.
These insights help you evaluate which products are gaining momentum, which need attention, and how product demand may impact sales incentives.
## 10. Leaderboard
Leaderboards rank sales reps based on performance metrics such as revenue, sales volume, or product-specific achievements.
They promote healthy competition, motivate sales teams to improve performance, and reinforce strategic selling behaviors aligned with organizational goals.
## 11. ASC 606 Compilation
Our implementation team will ensure that all of your sales commissions or incentive plans are fully compliant with respect to regulations including ASC 606, IFRS 15 and others.
Need help? Reach out to your support team or [cs@xoxoday.com](mailto:cs@xoxoday.com).
## 2. Quick Actions
Quick Actions allow you to easily navigate essential features —such as approval payouts, user management, group creation, and more.
You can customize the available actions based on the needs of each plan.
## 3. Users and Quota
The **Users** section displays who has achieved at least one milestone (*Eligible*) and who has not achieved any (*Not Eligible*).
The **Quota** section shows the overall quota achievement for each user.
## 4. Earnings
This view summarizes total user earnings, along with payouts that are pending approval or require rejection based on plan rules.
**Quick explainer video:**
[https://app.supademo.com/demo/clyctc6ry0l0xthf76rd95zyo?preview=true](https://app.supademo.com/demo/clyctc6ry0l0xthf76rd95zyo?preview=true)
## 5. Performance report
It provides a snapshot of users' performance across plans. You can customize it according to your needs, such as whether you want to see the performance of a particular plan or a specific set of users.
## 6. Metric vs Plans
This widget gives administrators a clearer understanding of plan ROI by comparing performance across selected KPIs.
It offers a comprehensive view of how different plans are performing relative to each other. You can tailor the comparison by selecting specific plans or metrics.
## 7. Plan payout trends
This view highlights how payouts are being distributed—monthly, quarterly, or yearly.
It also flags unusual trends so you can stay proactive and maintain payout accuracy.
## 8. Investment vs Revenue Generation
Understand your ROI by comparing your organization’s incentive or commission spend (plan budgets) with the revenue generated by your sales teams.
## 9. Product Sales Trends
This widget highlights patterns and shifts in product performance over time.
These insights help you evaluate which products are gaining momentum, which need attention, and how product demand may impact sales incentives.
## 10. Leaderboard
Leaderboards rank sales reps based on performance metrics such as revenue, sales volume, or product-specific achievements.
They promote healthy competition, motivate sales teams to improve performance, and reinforce strategic selling behaviors aligned with organizational goals.
## 11. ASC 606 Compilation
Our implementation team will ensure that all of your sales commissions or incentive plans are fully compliant with respect to regulations including ASC 606, IFRS 15 and others.
Need help? Reach out to your support team or [cs@xoxoday.com](mailto:cs@xoxoday.com).