> ## Documentation Index
> Fetch the complete documentation index at: https://help-empuls.xoxoday.com/llms.txt
> Use this file to discover all available pages before exploring further.
# Organization dashboard
> Live account status, R&R dashboard, engagement summary, and data overview for Super Admins.
Super Admins can access information about the allocated budgets and their utilisation, live programme status, and deep organisational analytics from the organization dashboard.
To access: Navigate to **Admin Hub → Reports → My Organization**.
***
## Account live status
Tracking rewards points, nominations, and budgets is simple with live status reports. The Super Admin can manage all R\&R tracking in one place, with the most up-to-date information on programme parameters.
You can track your **Budget Usage**, **Available Budget Points**, **Redemption Points**, **Redemption Wallet Balance**, and **Pending Nominations** status.
**Step 1:** Navigate to **Home → Reports and Admin** to land on the admin dashboard. Click on **Reports → My Organization** to access live status reports. This report is updated on a real-time basis.
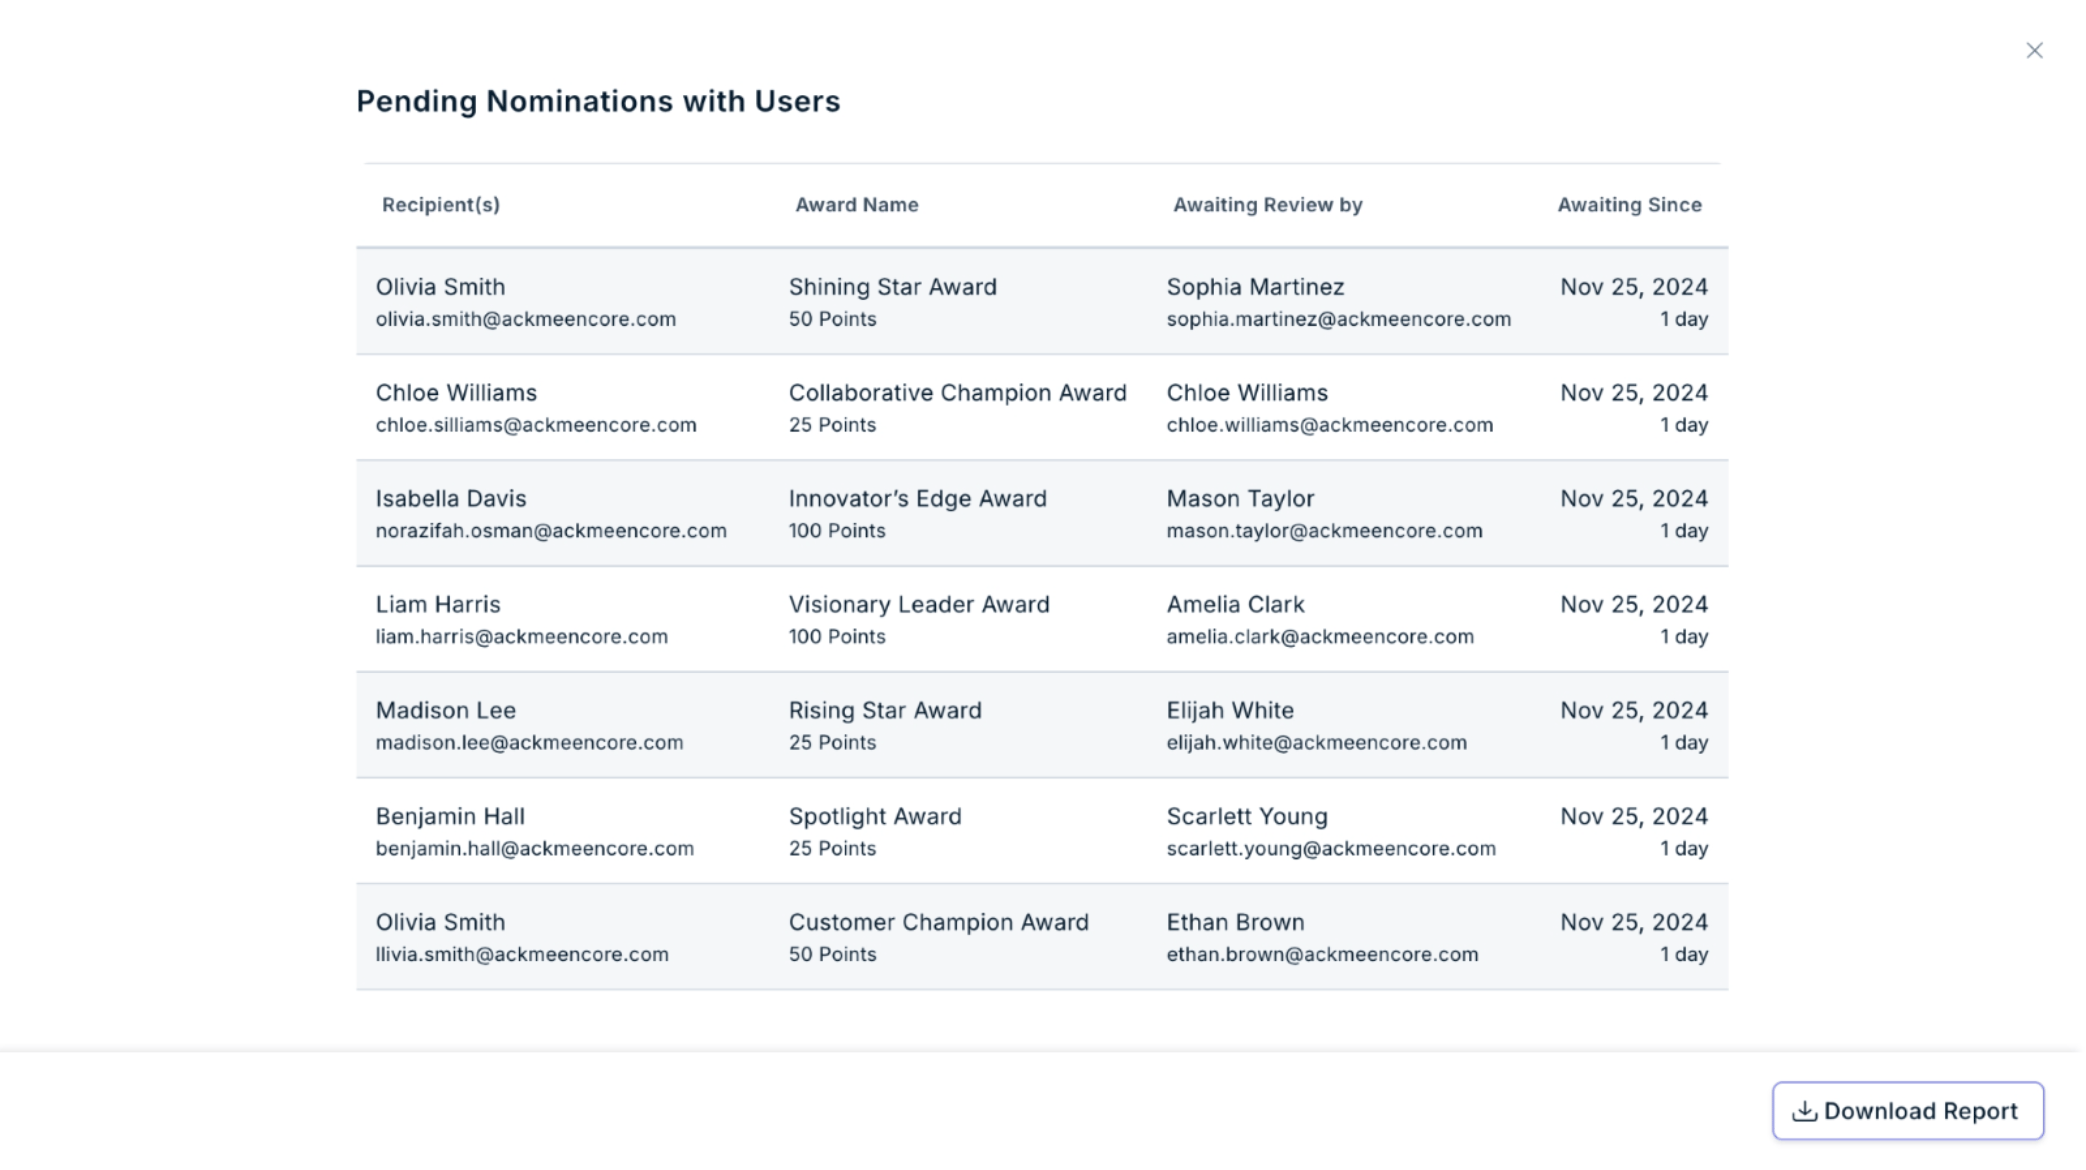
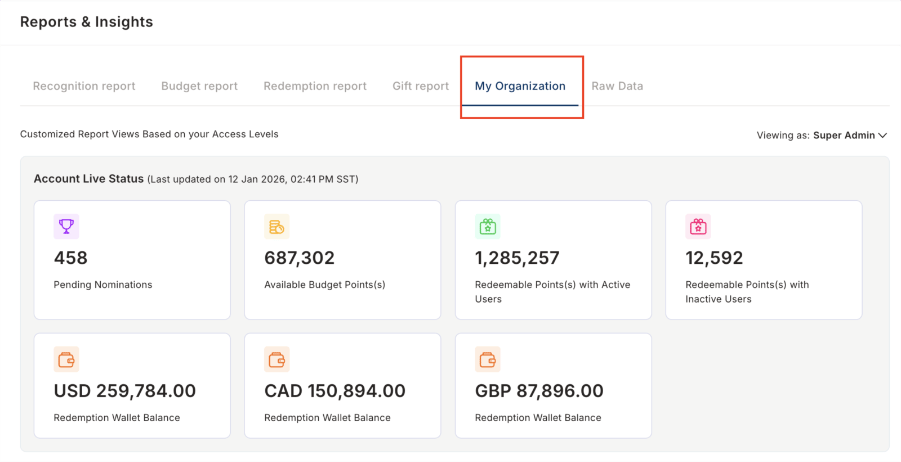 The report can also be viewed as an HRBP. Use the drop-down on the right of the report and select your view. By clicking on any report, you will see the entire report with an option to download it.
 ***
## R\&R dashboard
Track the effectiveness of your recognition and reward efforts with the live R\&R dashboard. The dashboard provides comprehensive usage reports for Super Admins.
**Step 1:** Navigate to **Home → Reports and Admin** to land on the admin dashboard. Click on **Reports → My Organization** to view the dashboard.
### Engagement summary
The engagement summary provides data about the following:
* The engagement summary provides detailed information on awards, core values, gifts, and survey data.
* Core value data summarises core values, receiver/recipient name, sender name, and date.
* Gifts data provides details on the greeting event, greeting name, gift value, receiver/recipient, date, and status, and you can download the report by clicking **Download Report**.
* Award data provides details including award name, reward value, receiver/recipient Emp ID and name, nominator Emp ID and name, budget name and owner name, nominated and approved dates, and status.
* Survey data report provides data on survey name, creator email, survey creation date, status, total invited, and total responded.
* Active groups data report lists active group names and the total number of discussion threads for each group.
***
## R\&R dashboard
Track the effectiveness of your recognition and reward efforts with the live R\&R dashboard. The dashboard provides comprehensive usage reports for Super Admins.
**Step 1:** Navigate to **Home → Reports and Admin** to land on the admin dashboard. Click on **Reports → My Organization** to view the dashboard.
### Engagement summary
The engagement summary provides data about the following:
* The engagement summary provides detailed information on awards, core values, gifts, and survey data.
* Core value data summarises core values, receiver/recipient name, sender name, and date.
* Gifts data provides details on the greeting event, greeting name, gift value, receiver/recipient, date, and status, and you can download the report by clicking **Download Report**.
* Award data provides details including award name, reward value, receiver/recipient Emp ID and name, nominator Emp ID and name, budget name and owner name, nominated and approved dates, and status.
* Survey data report provides data on survey name, creator email, survey creation date, status, total invited, and total responded.
* Active groups data report lists active group names and the total number of discussion threads for each group.
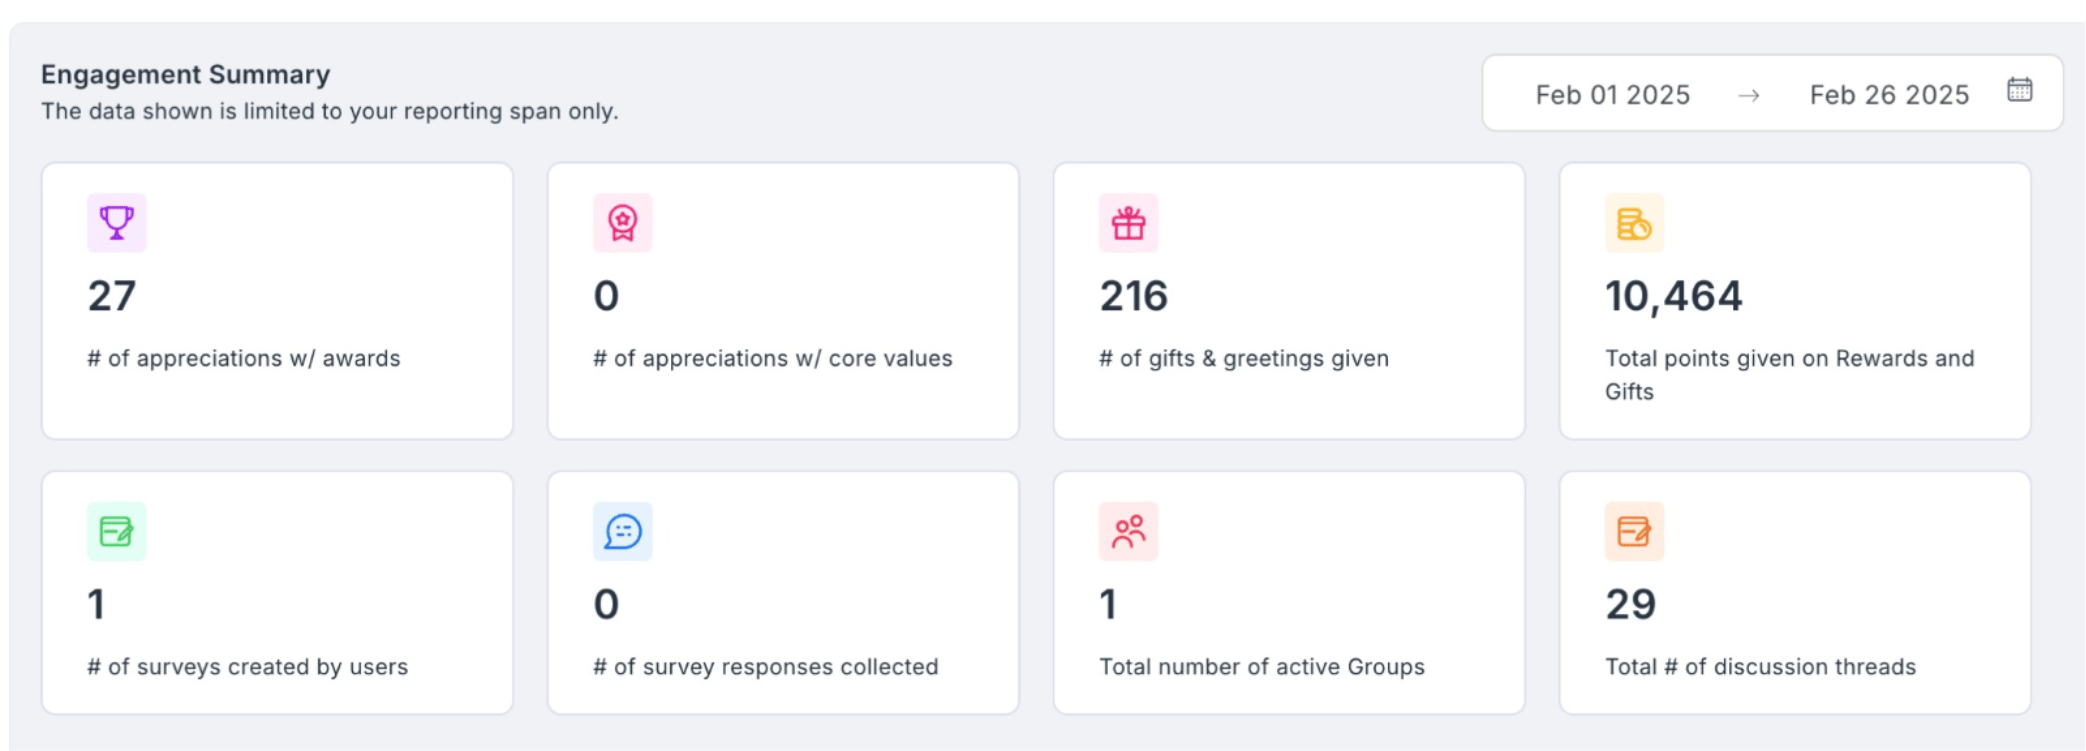 The data displayed is limited to your selected reporting span. Click on the calendar icon and choose the required dates. You can also download different reports by clicking **Download Report**.
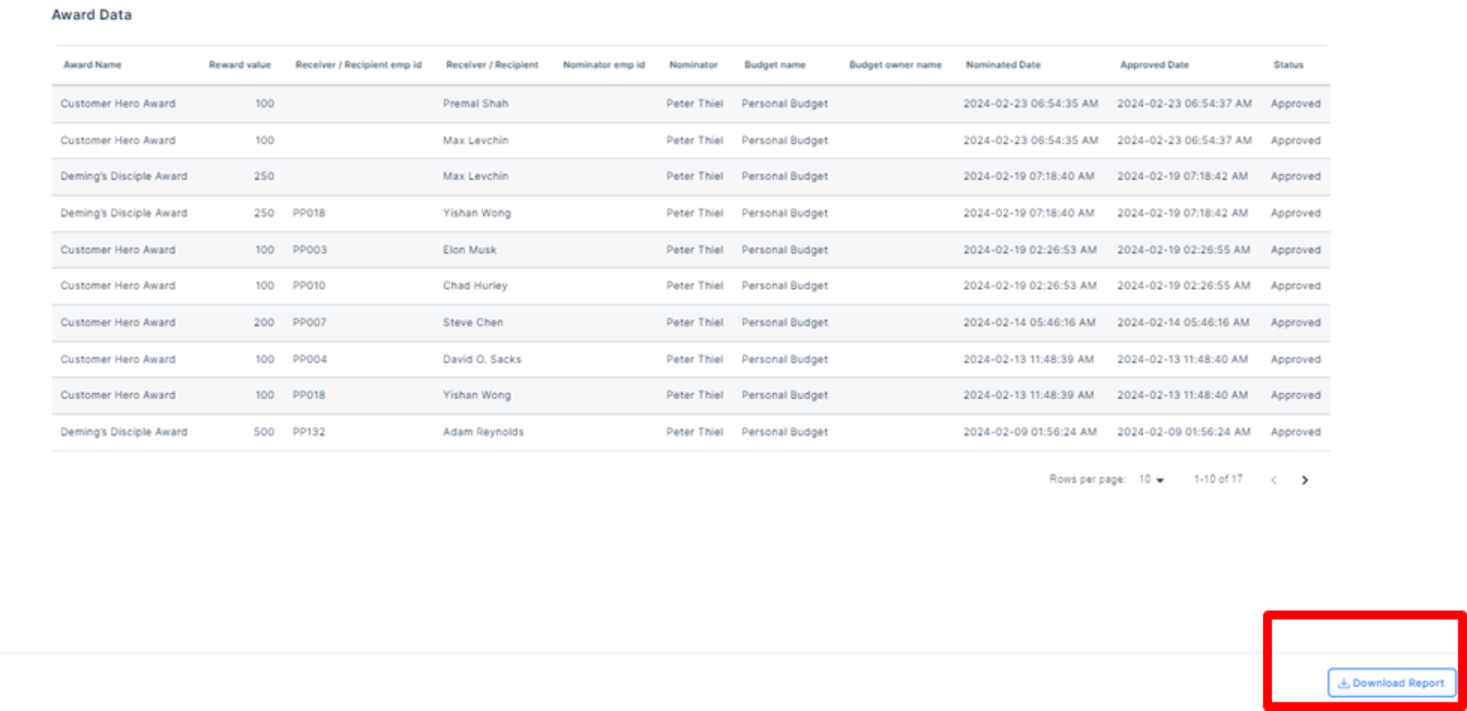 Super Admins have access to a range of reports. Below is a list of the available reports.
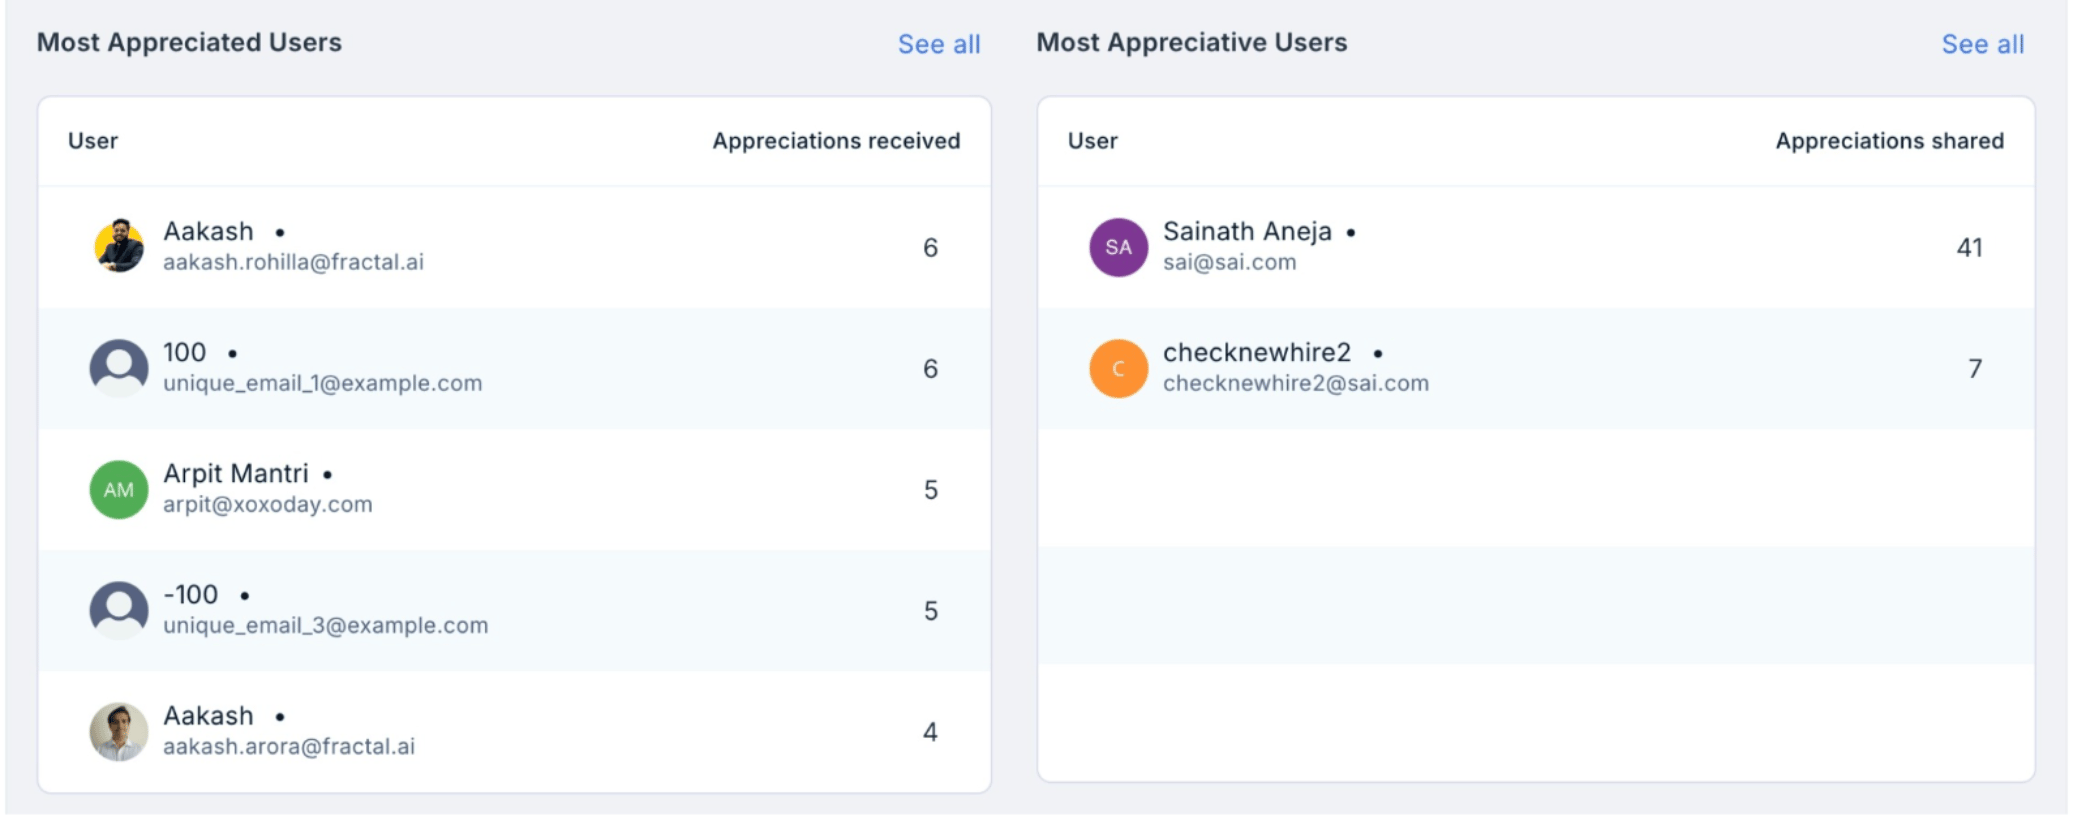
* The **Appreciated Users List** includes the name, email, and total appreciations received. The **Appreciative Users List** displays each user's name, email, and total appreciations shared.
Super Admins have access to a range of reports. Below is a list of the available reports.
* The **Appreciated Users List** includes the name, email, and total appreciations received. The **Appreciative Users List** displays each user's name, email, and total appreciations shared.
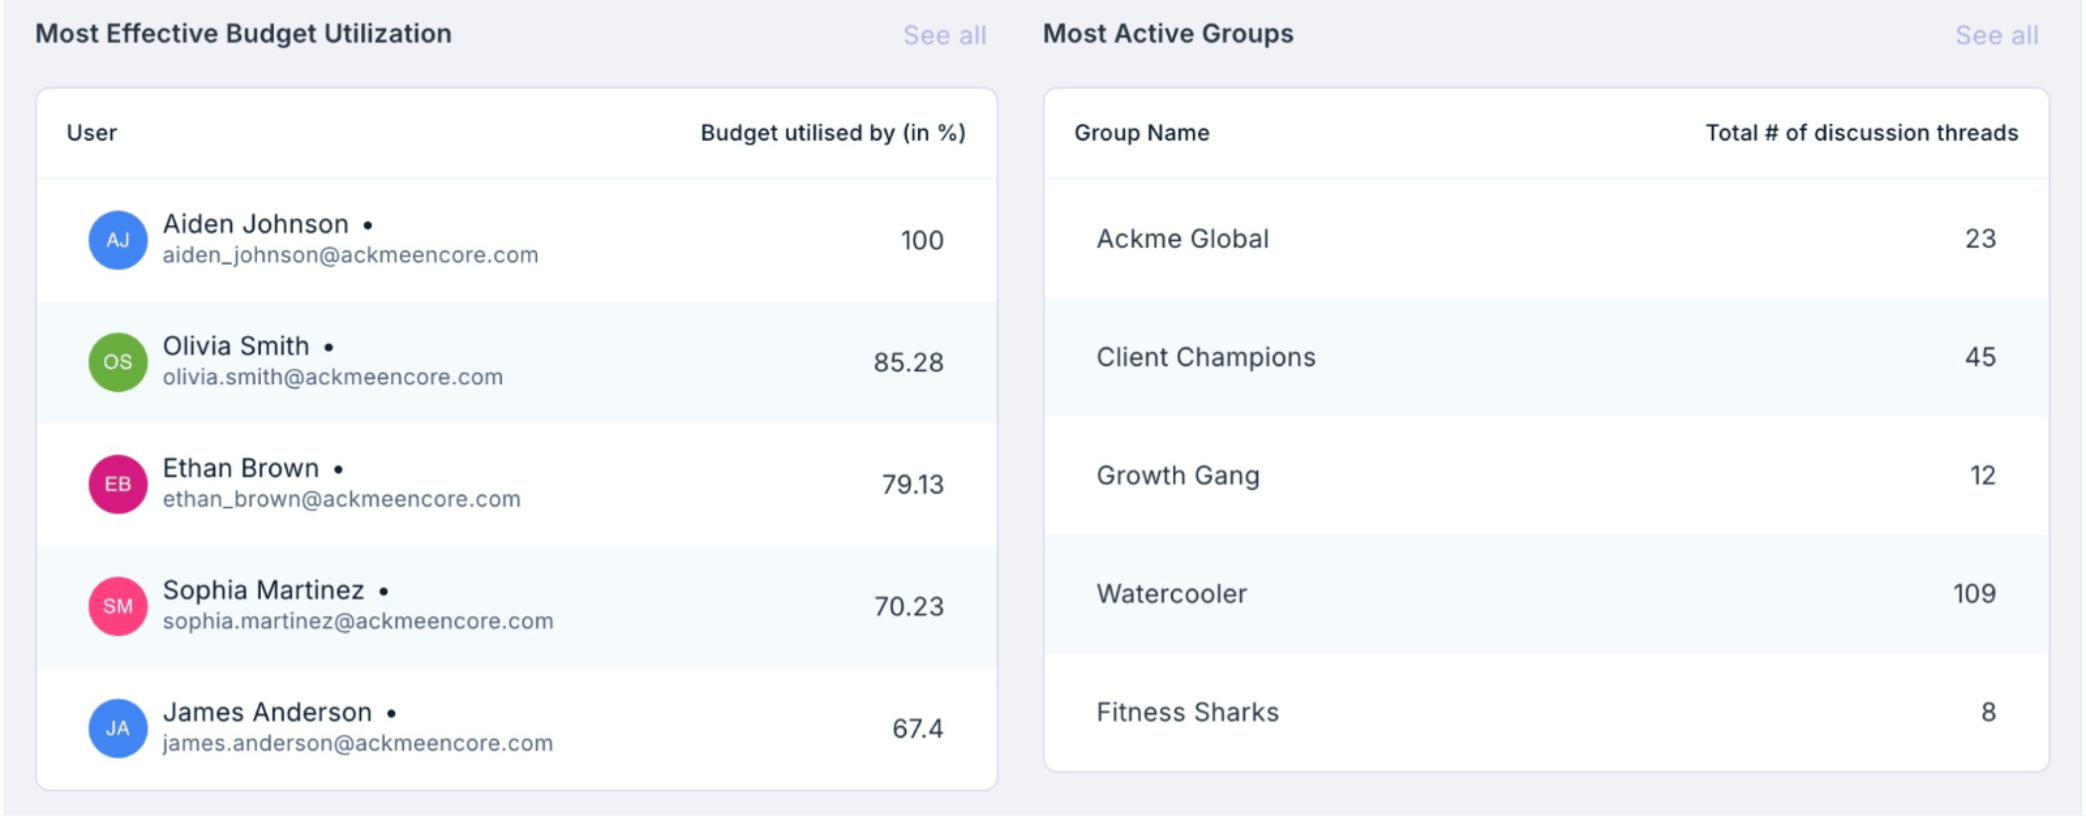
 * **Most effective budget utilisation** provides data on the user's name, email, and the budget utilised by the user (in %).
* **Most active groups** lists data on the group name and the number of discussion threads.
* **Most effective budget utilisation** provides data on the user's name, email, and the budget utilised by the user (in %).
* **Most active groups** lists data on the group name and the number of discussion threads.
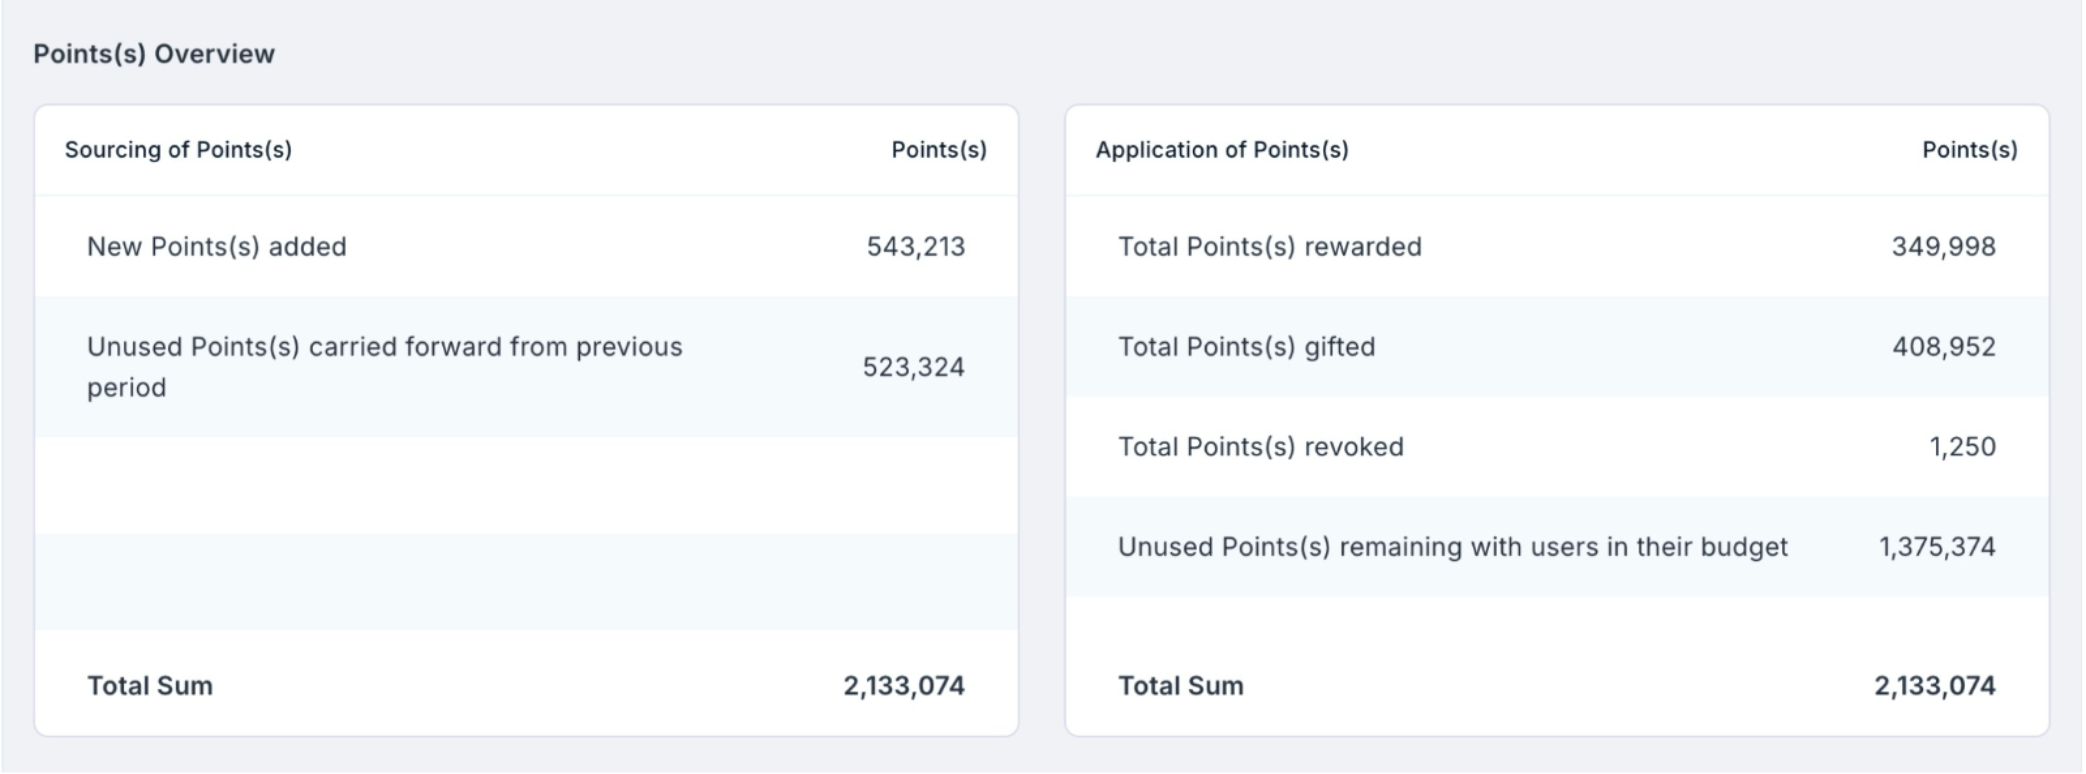
 * **Points overview** lists the source of points, new points added, and unused points.
* **Application of points** report lists down the number of points rewarded, sent out as gifts, and unused points.
* **Points overview** lists the source of points, new points added, and unused points.
* **Application of points** report lists down the number of points rewarded, sent out as gifts, and unused points.
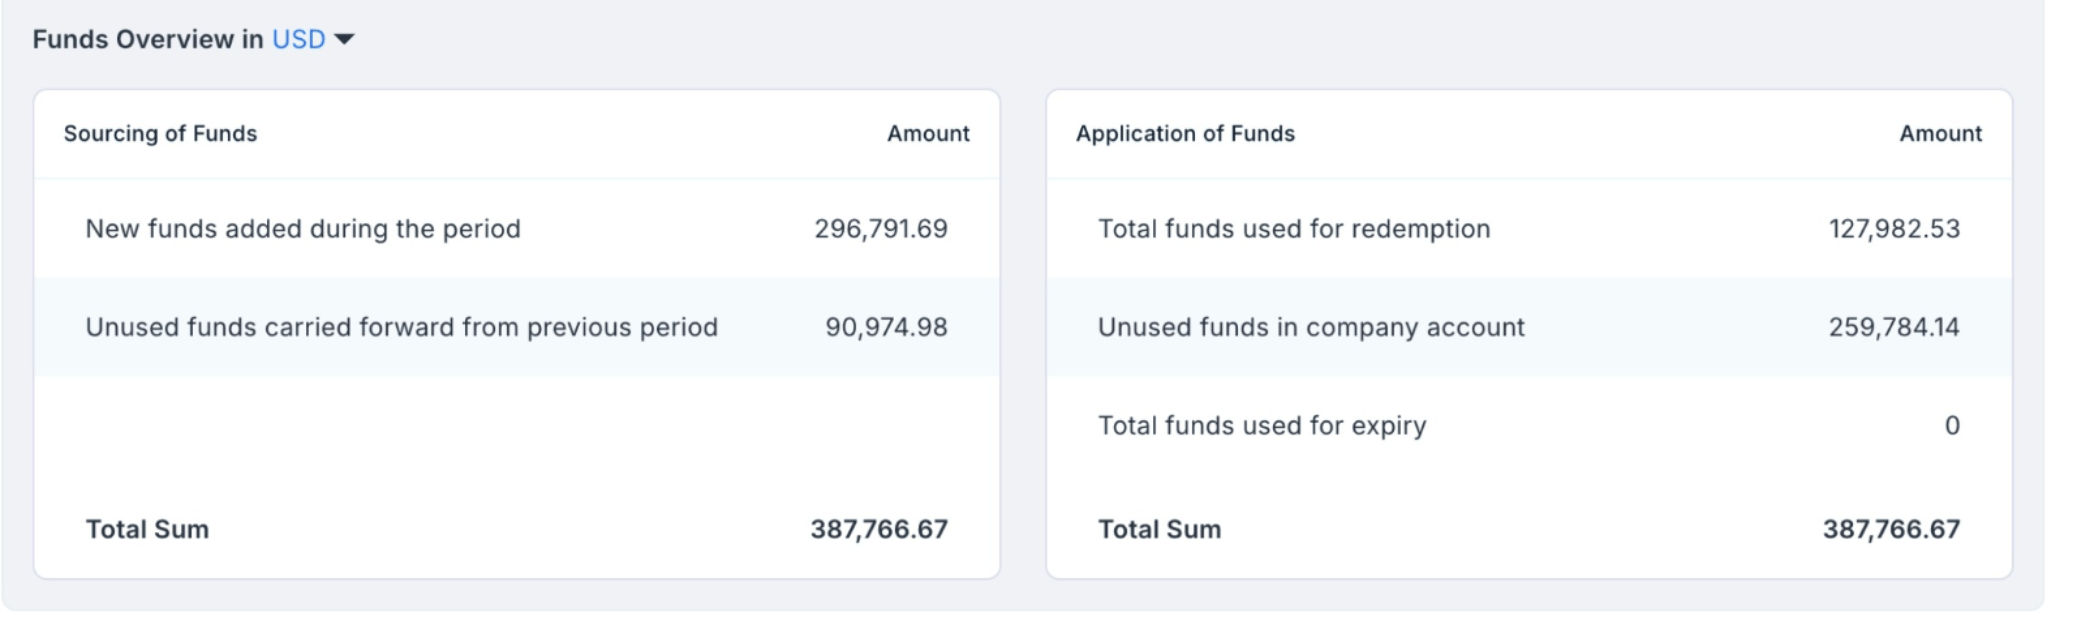
 * **Funds overview** provides details about the new funds added and the unused funds.
* **Application of funds** provides total funds used for redemption, unused funds, and total funds used for expiry.
* **Funds overview** provides details about the new funds added and the unused funds.
* **Application of funds** provides total funds used for redemption, unused funds, and total funds used for expiry.
 ***
### Data overview
The data section of reports gives complete details of feeds on the platform (conversations), skill set in the organisation, budget lifecycle (budgets), and award usage (awards).
Navigate to **Home → Reports and Admin** to land on the admin dashboard. Click on **Reports → My Organization** and scroll down for data overview.
***
### Data overview
The data section of reports gives complete details of feeds on the platform (conversations), skill set in the organisation, budget lifecycle (budgets), and award usage (awards).
Navigate to **Home → Reports and Admin** to land on the admin dashboard. Click on **Reports → My Organization** and scroll down for data overview.
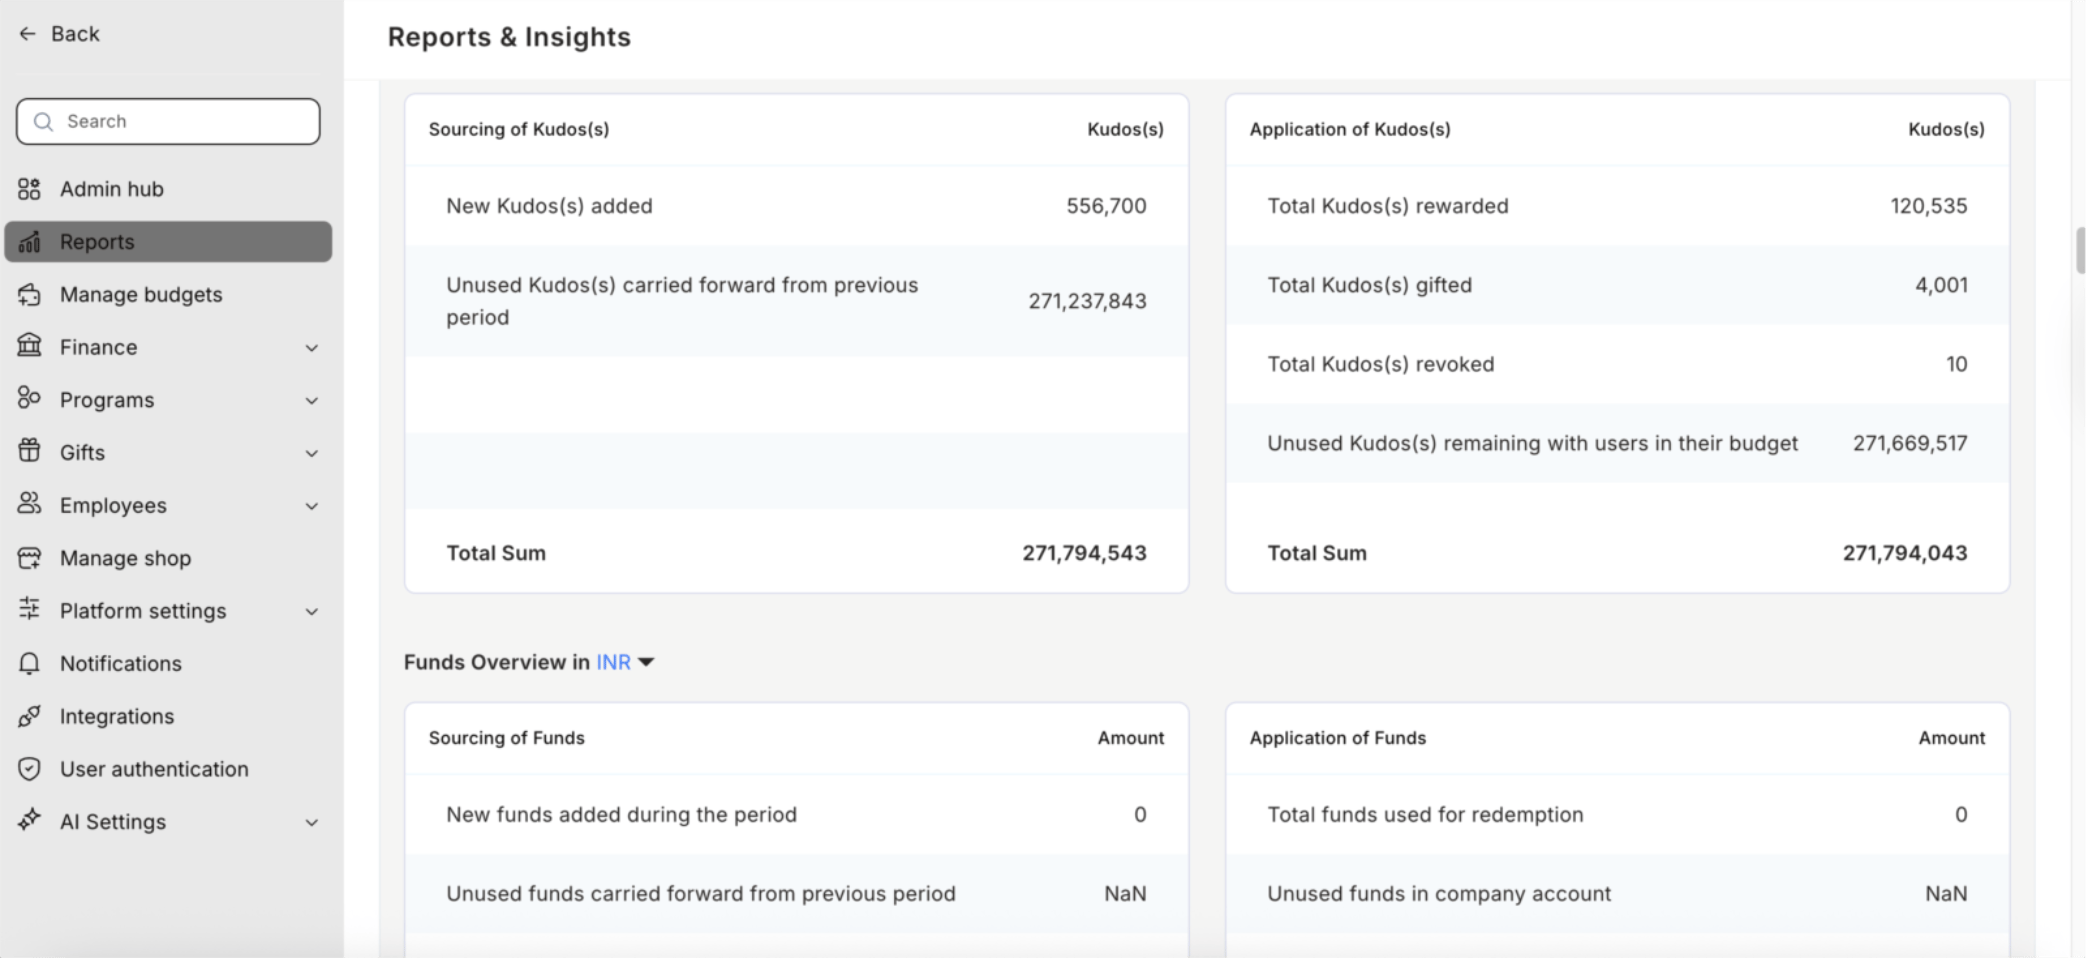 You can see the skills in your employees which are defined across 4 types — Communication, Interpersonal, Critical Thinking, and Leadership. Each skill has multiple sub-skills, represented in the spider graph. By using the filter, the graph will show the skills of the selected filter. You can view the skills based on the filter of department, designation, grade, business unit, location, and cost center.
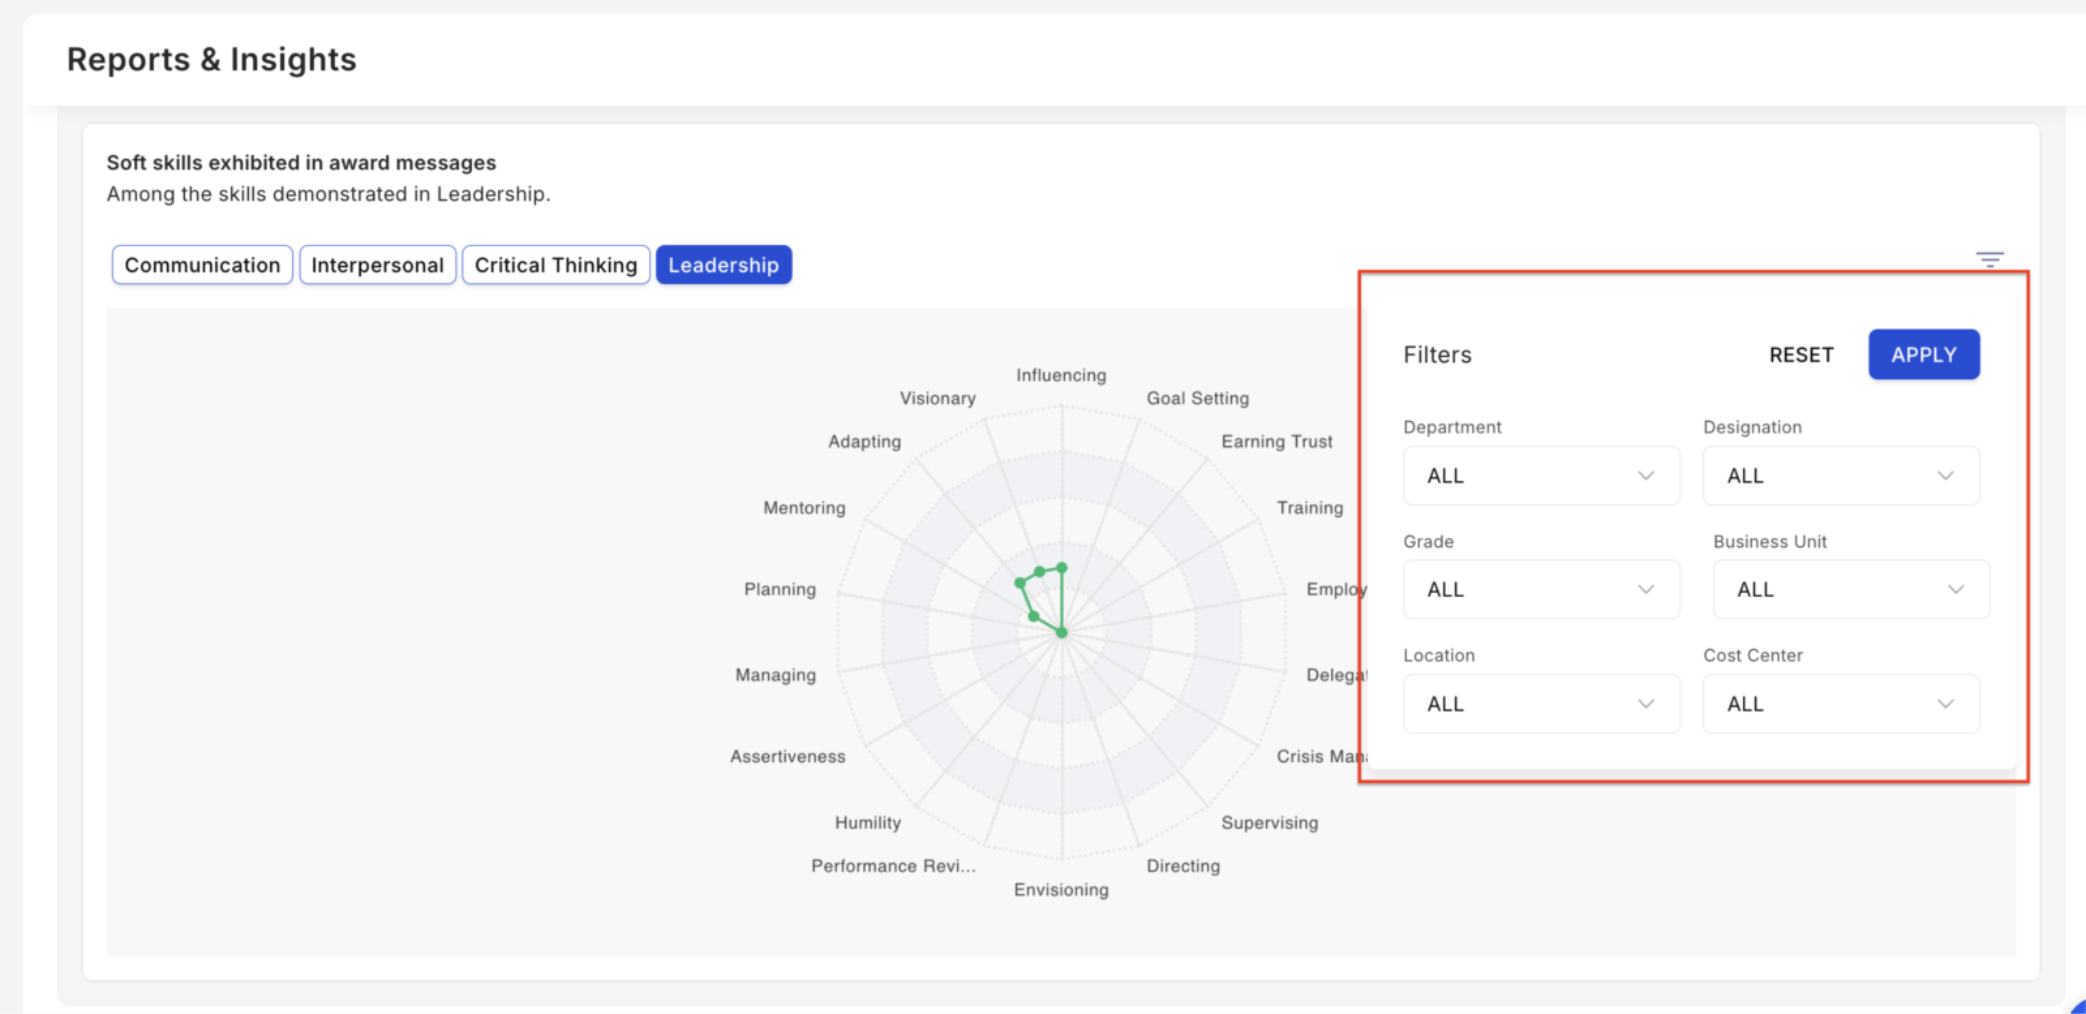 You can customise the report for a specific pivot. Click on **Pivot by Department** and select the option required. You can pivot by Department, Designation, Cost Center, Business Units, Grades, and Location.
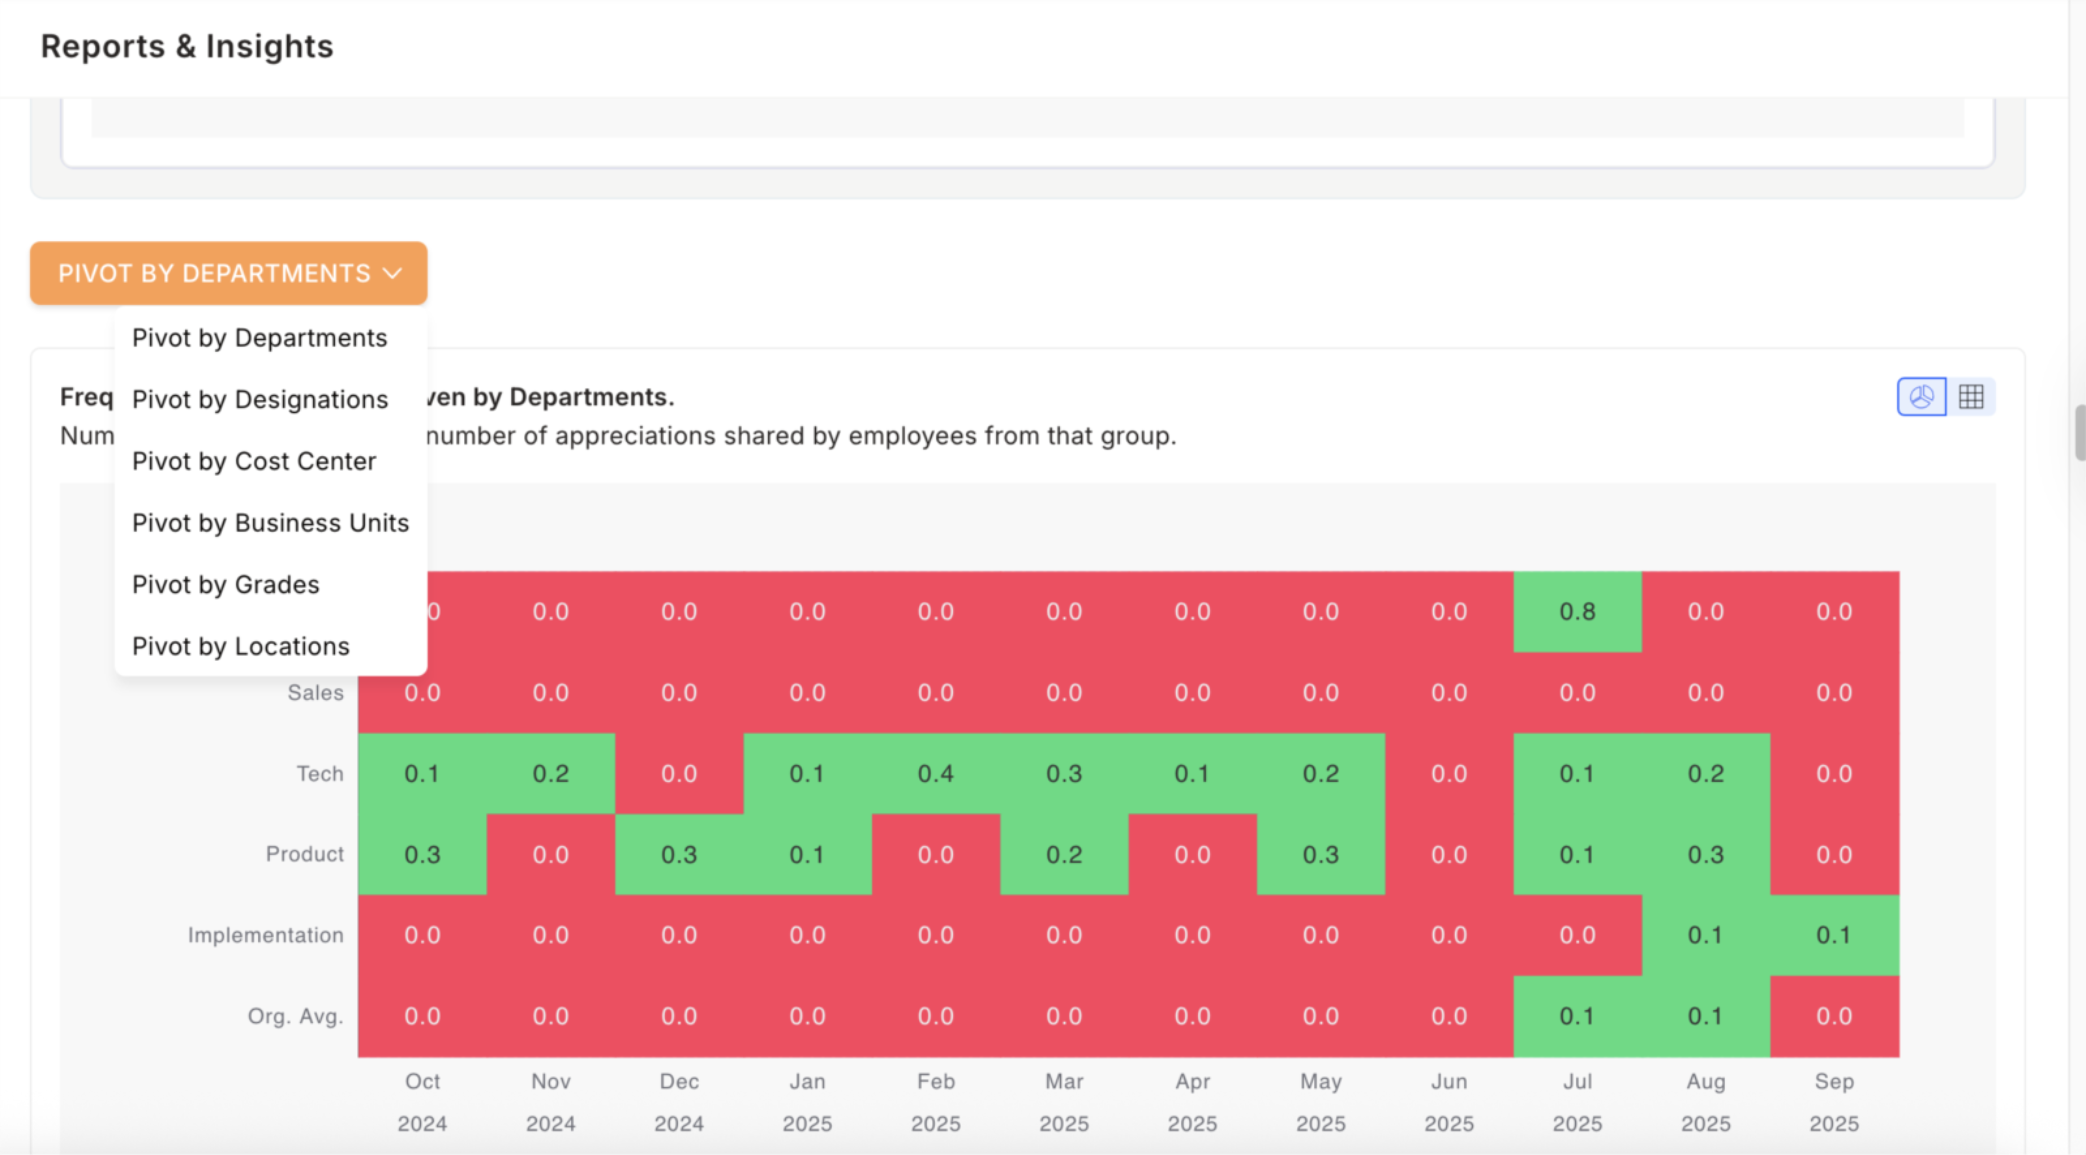 On the top right side of the report you can toggle between a graph or table format.
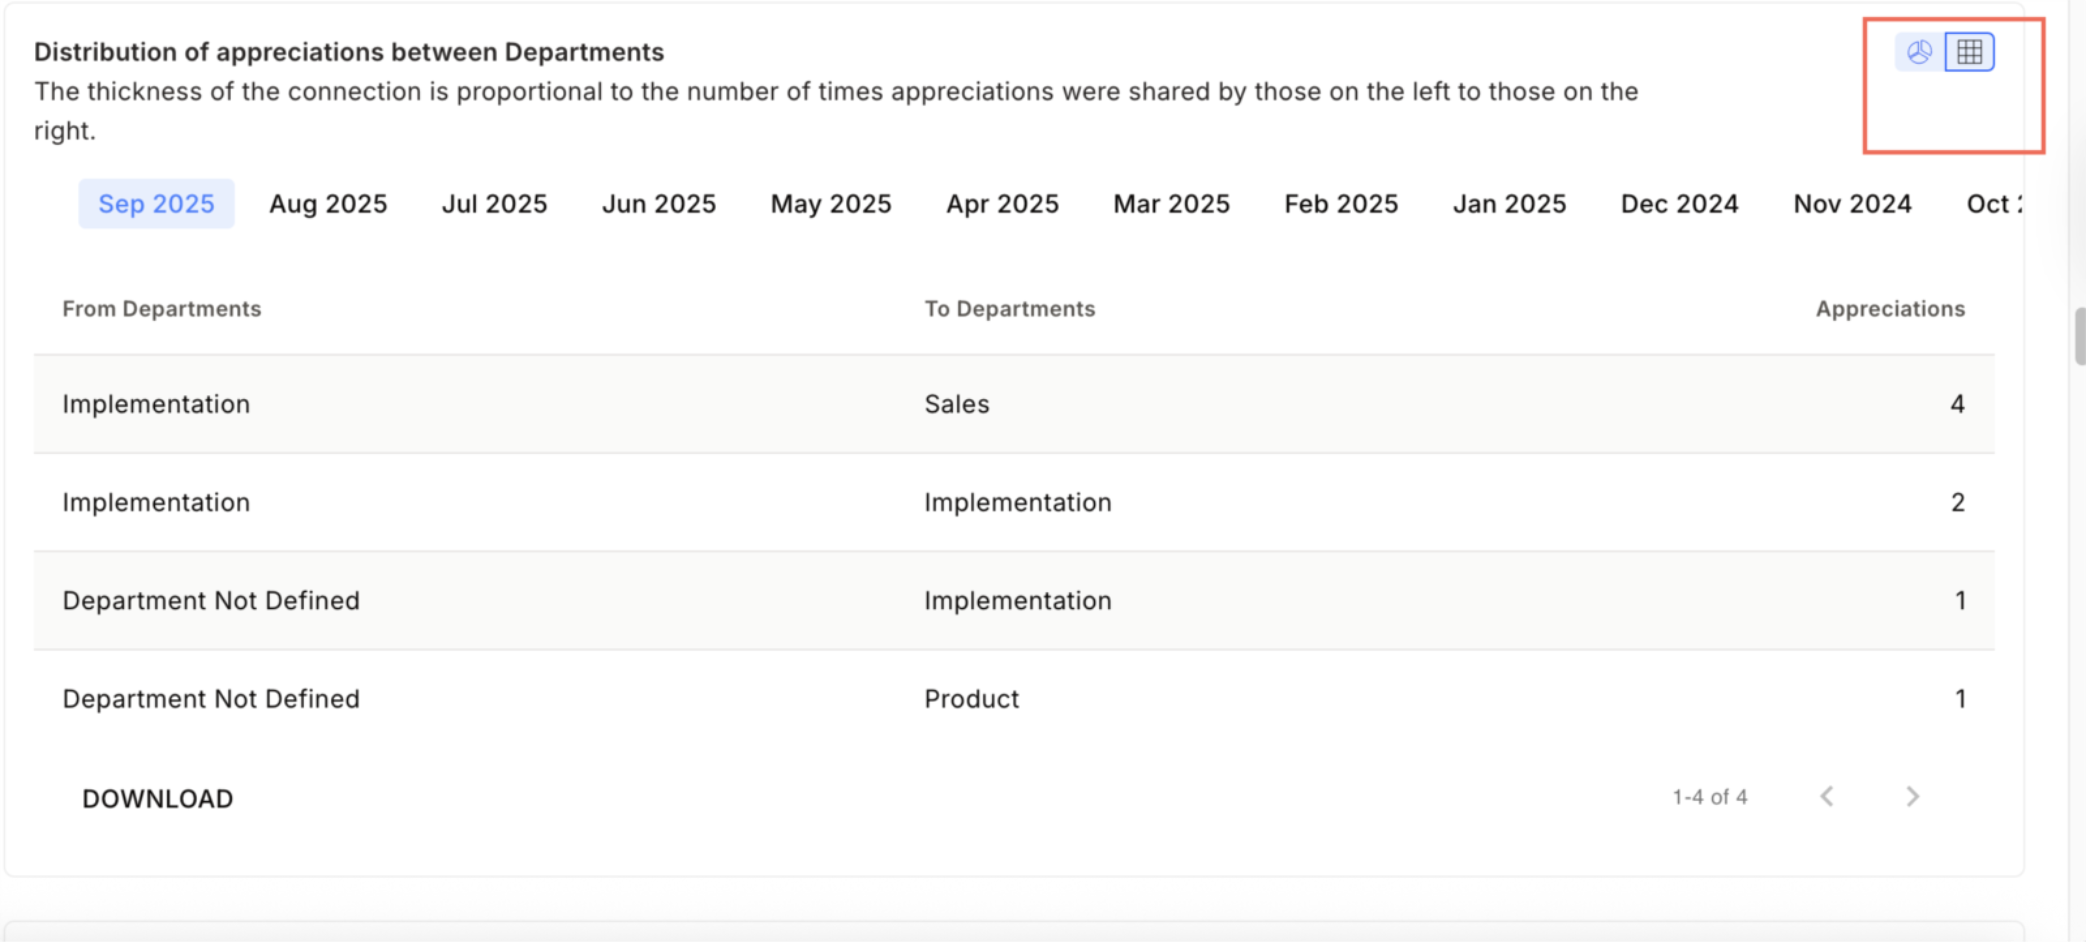 Click **Download** to download the report as a PDF.
 You can view details of the following data:
* **Frequency of appreciations given:** Numbers indicate the average number of appreciations shared by employees from that group.
* **Frequency of appreciations received:** Numbers indicate the average number of appreciations received by employees in that group.
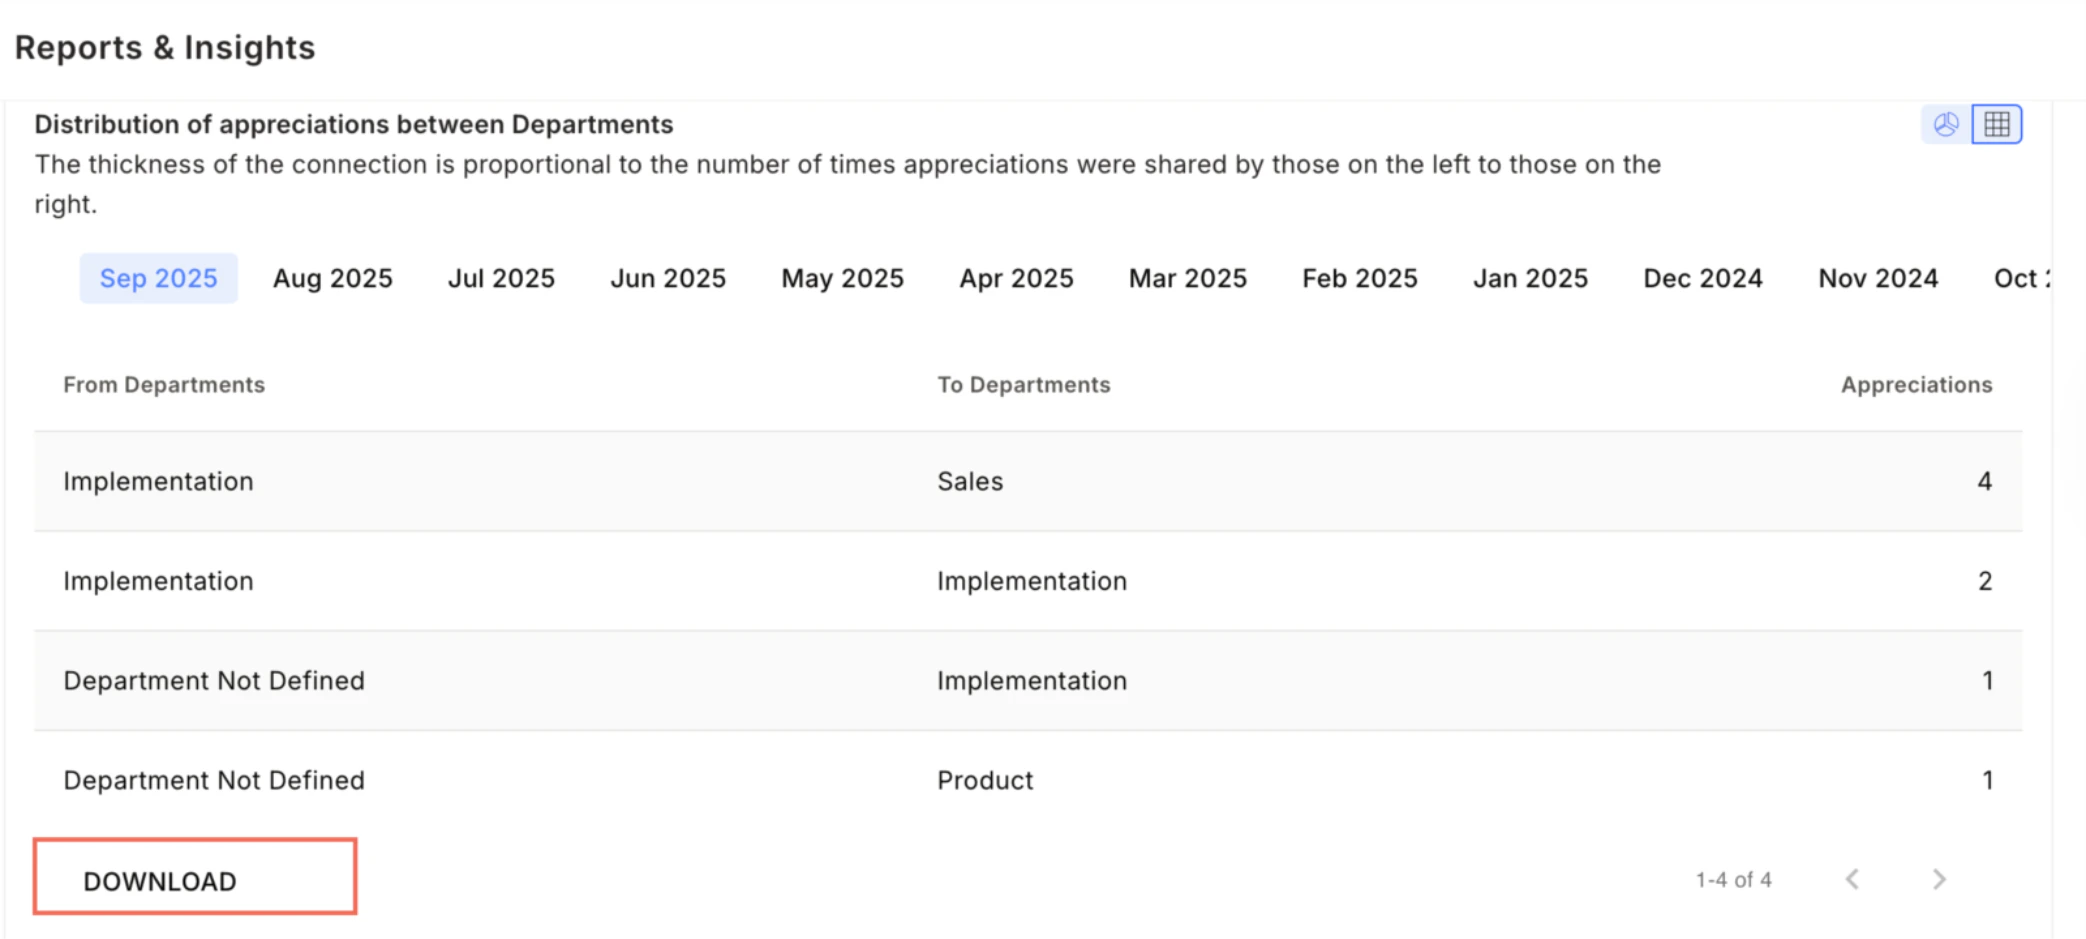
* **Distribution of appreciations:** The thickness of the connection is proportional to the number of times appreciations were shared by those on the left to those on the right.
* **Reward budget utilisation:** Numbers indicate the percentage of budget used for awards and it ranges from 0% to 100%. Blanks indicate you didn't allocate budgets.
* **Average point(s) given:** Numbers indicate the average number of reward points given by an employee in the group.
* **Average point(s) received:** Numbers indicate the average number of points received as gifts by an employee in the group.
* **Frequency of nominations raised:** Numbers indicate the average number of nominations raised by an employee in the group.
* **Point(s) remaining:** Shows data for groups with the highest number of points available for redemption.
* **Monthly active users:** Percentage of users who accessed Empuls across months.
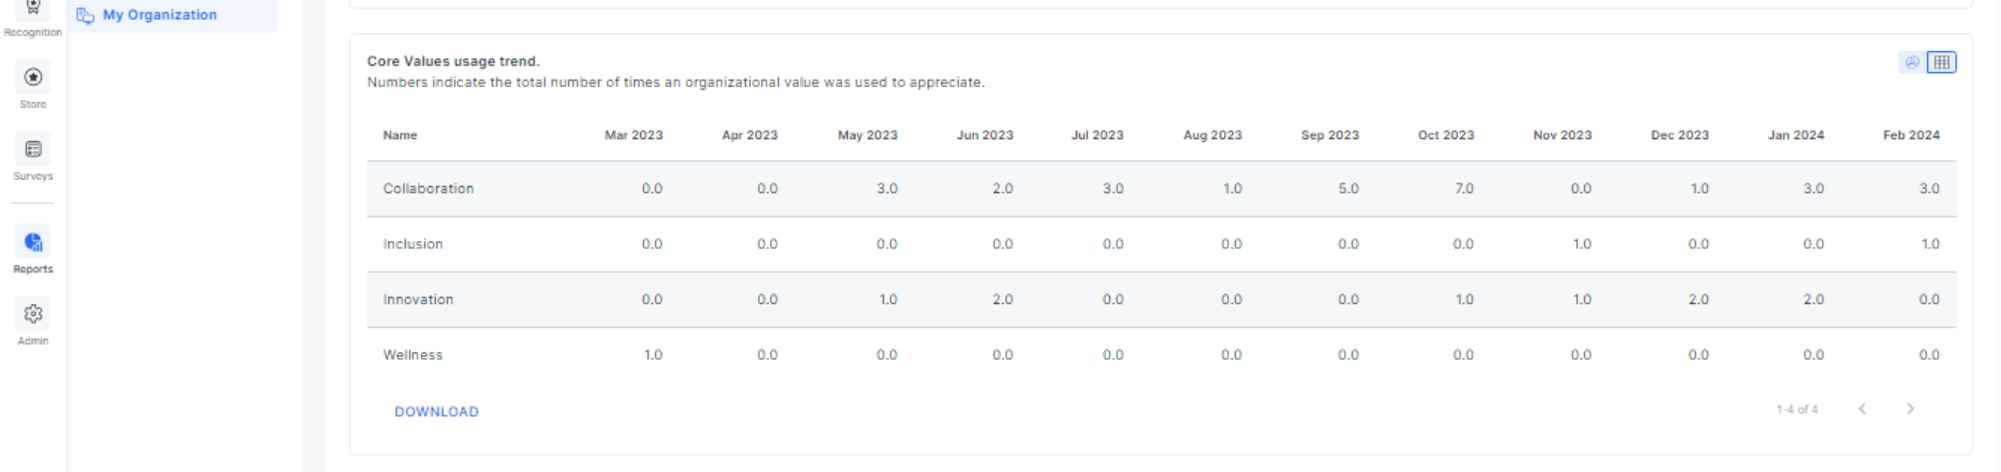
* **Core values usage trend:** Numbers indicate the number of times an organisational value was used to appreciate.
You can view details of the following data:
* **Frequency of appreciations given:** Numbers indicate the average number of appreciations shared by employees from that group.
* **Frequency of appreciations received:** Numbers indicate the average number of appreciations received by employees in that group.
* **Distribution of appreciations:** The thickness of the connection is proportional to the number of times appreciations were shared by those on the left to those on the right.
* **Reward budget utilisation:** Numbers indicate the percentage of budget used for awards and it ranges from 0% to 100%. Blanks indicate you didn't allocate budgets.
* **Average point(s) given:** Numbers indicate the average number of reward points given by an employee in the group.
* **Average point(s) received:** Numbers indicate the average number of points received as gifts by an employee in the group.
* **Frequency of nominations raised:** Numbers indicate the average number of nominations raised by an employee in the group.
* **Point(s) remaining:** Shows data for groups with the highest number of points available for redemption.
* **Monthly active users:** Percentage of users who accessed Empuls across months.
* **Core values usage trend:** Numbers indicate the number of times an organisational value was used to appreciate.
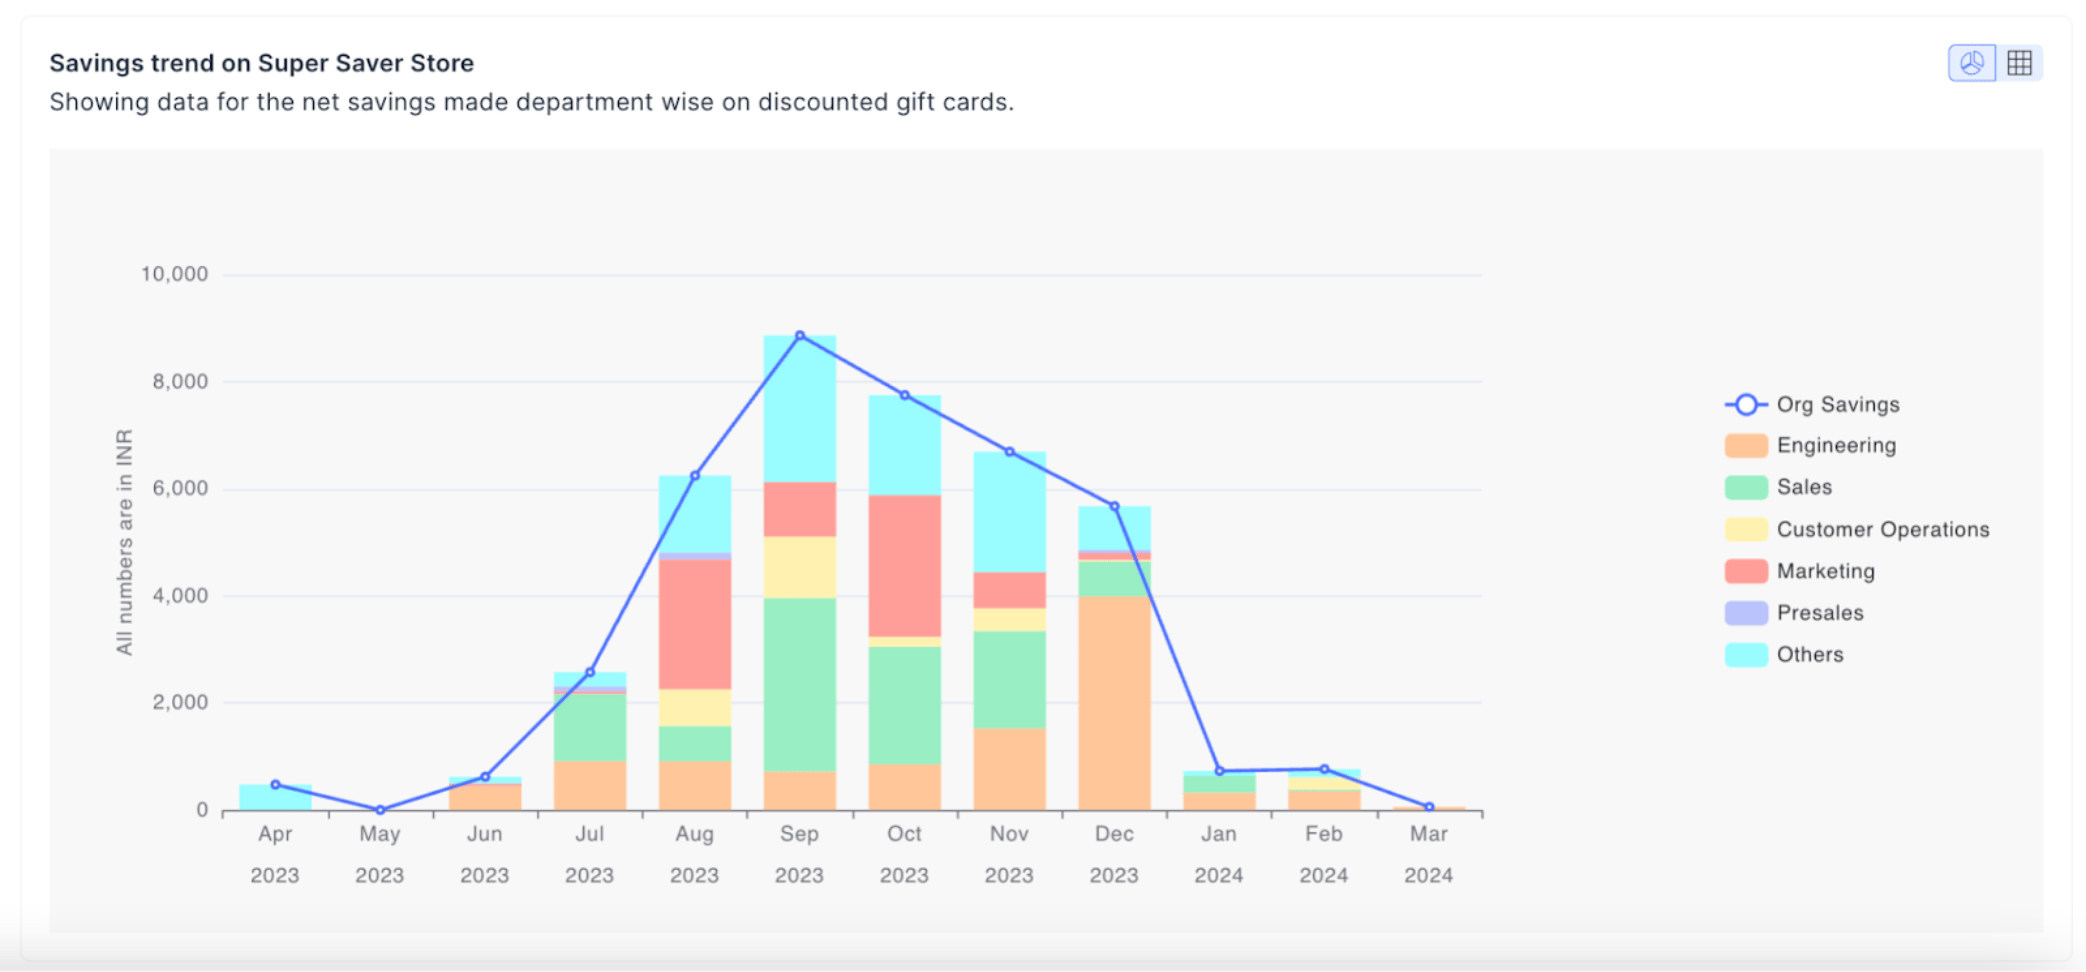
 * **Savings trend (perks usage):** Indicates data for the net savings made department-wise on discounted gift cards.
 ***
## FAQs
The organization dashboard is available to Super Admins and HRBPs. Super Admins see company-wide data. HRBPs can switch views using the drop-down on the right of the report to see data relevant to their business unit.
The account live status report is updated on a real-time basis. This means budget usage, pending nominations, redemption wallet balances, and other metrics reflect the most current state of the platform.
Yes. Click **Download Report** on any individual section, or click **Download** at the top of the data overview to export it as a PDF.
## Related
Overview of all report types available in Empuls.
Decode soft skills embedded in recognition data shown in the data overview.
Detailed budget utilisation and points movement.
Drill into recognition given and received by individual employees.
***
## FAQs
The organization dashboard is available to Super Admins and HRBPs. Super Admins see company-wide data. HRBPs can switch views using the drop-down on the right of the report to see data relevant to their business unit.
The account live status report is updated on a real-time basis. This means budget usage, pending nominations, redemption wallet balances, and other metrics reflect the most current state of the platform.
Yes. Click **Download Report** on any individual section, or click **Download** at the top of the data overview to export it as a PDF.
## Related
Overview of all report types available in Empuls.
Decode soft skills embedded in recognition data shown in the data overview.
Detailed budget utilisation and points movement.
Drill into recognition given and received by individual employees.